
Resource Library
Google Sheets Integration
Datameer’s Google Sheets integration offers a seamless way to synchronize your Snowflake data with Google Sheets, providing you with real-time and updated information.
Dataset Caching
Datameer‘s Dataset Caching feature speeds up your workflow and enhances preview performance, reducing empty previews and speeding up downstream transformations.
Metadata Inspector
Datameer’s new Metadata Inspector eliminates the need to switch between screens and tabs, providing a single, user-friendly interface for viewing and updating metadata.
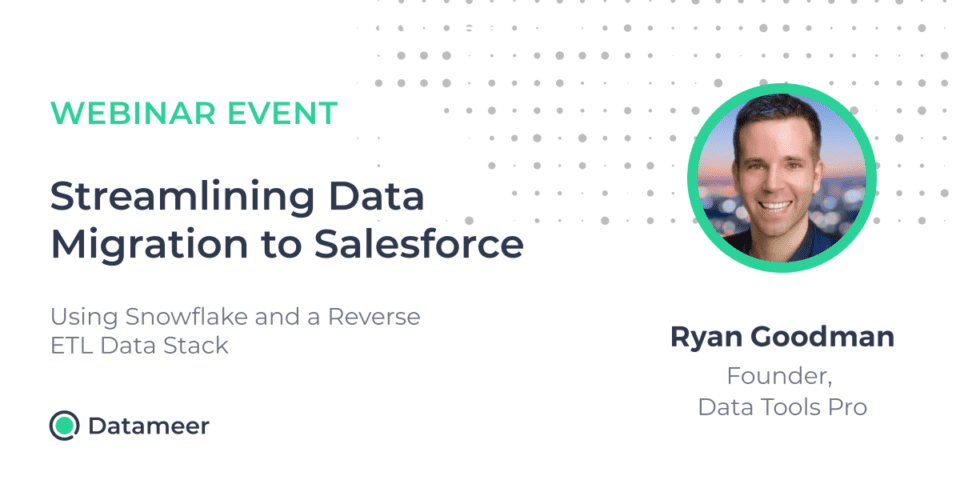
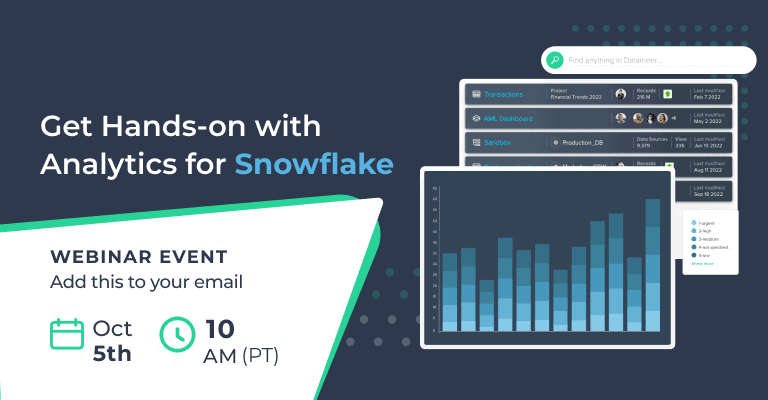
Streamlining Data Migration to Salesforce using Snowflake & a Reverse ETL Data Stack
Discover how Snowflake’s data warehousing capabilities can streamline your data migration to Salesforce. Join Datameer’s webinar for expert tips, best practices, and real-world use cases.
Slack Integration
Datameer’s Slack integration allows for real-time collaboration and streamlined data workflows between teams. Learn more now.

Skylar Success Story
Skylar achieved a 302% increase in data transformation speed using Datameer, a cost-effective and user-friendly data processing and analysis platform. With Datameer’s automation capabilities and intuitive user interface, Skylar saved time, improved accuracy, and increased efficiency in their data workflows.
Snowflake Quick Start: Getting Started With Datameer
Get started with Datameer in this Snowflake-hosted getting started guide. We’ll show you how to sign up and access your data to run no-code, low-code and SQL transformations in Datameer. Join, explore, and aggregate data. As well as deploy and upload your data to Snowflake.
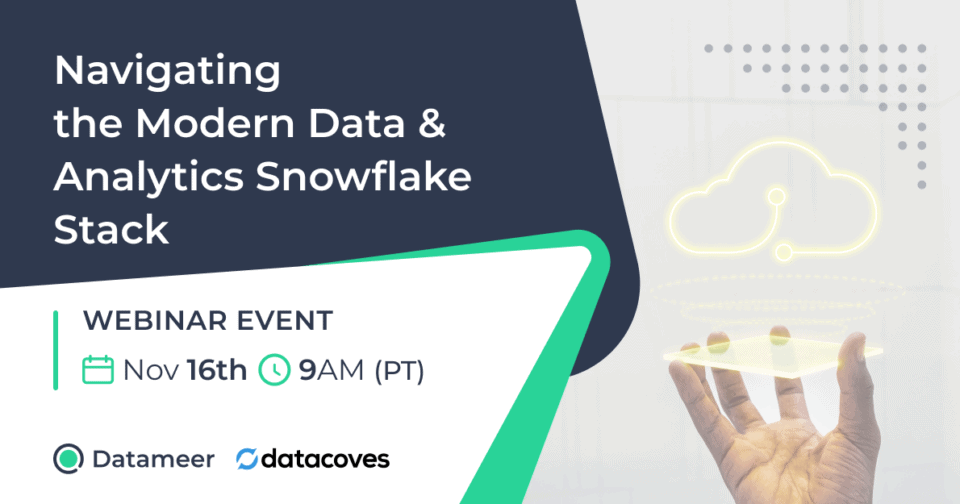
Navigating the Modern Data & Analytics Snowflake Stack
Learn how to navigate the modern data analytics cloud stack with Datameer, the leading data analytics platform, and unlock the power of cloud-based data analysis for your business.
Working with JSON in Snowflake
With Datameer, working with JSON in Snowflake is easy. Understand your JSON objects and extract the data you need.
What is Data Modeling and How Do You Do It?
Data modeling is the process of defining data content and structure for a specific purpose. The 3 phases include: create, translate, implement
Virtual Hands-On Lab With Datameer
Join our virtual hands-on lab with Datameer and gain practical experience with our powerful data preparation and analytics platform for accelerating insights and unlocking the value of your data.
Schedule and Email Reports from Snowflake
With Datameer, scheduling and emailing reports from Snowflake is as easy as clicking send. No more workarounds, just to share your Snowflake data.

Reliant Funding Case Study
In this Reliant Funding case study we’ll see how Reliant Funding lowers data engineering time by 5x and produces just-in-time insights with Datameer.
Upload CSV to Snowflake
Problems getting your CSV into Snowflake? With Datameer, you’re only a few clicks away from uploading your CSV files to Snowflake!
Fivetran and Datameer
Combine Fivetran and Datameer for a highly efficient and cost-effective modern data stack for Snowflake.
Sigma Computing and Datameer
Use the combination of Sigma computing and Datameer for self-service data modeling, transformation, and exploration to deliver faster ad-hoc analytics insights.
Qlik Replicate and Datameer
Combine Qlik and Datameer for a highly efficient and cost-effective modern data stack that delivers Qlik analytics projects faster.
Stitch Data and Datameer
Combine Stitch Data and Datameer for a highly efficient and cost-effective modern data stack for Snowflake.
Datameer for ThoughtSpot
How to quickly and easily transform your data for ThoughtSpot using Datameer. Agile Data Transformation, For Hybrid Teams, Deploy Datasets.
Snowflake Native Data Transformation for Analytics
Unlock the power of Snowflake-native data transformation for advanced analytics with Datameer – Join our event to learn how to accelerate your data-driven insights and drive business success.

Datameer Datasheet
Learn more about Datameer’s unique, multi-persona SaaS data transformation solution.
What is Data Enrichment?
Learn how data enrichment can add more value to your analytics and easy-to-use tools that can help you enrich your data without writing code.
Demo Center
Datameer Demo Center is your self-service resource to maximize Datameer. Watch demo videos on how to start transforming your data.

How Reliant Funding replaced Tableau Prep with Datameer and cut down their data engineering time by 500%
Learn how VP of BI and Analytics of Reliant Funding replaced Tableau Prep with Datameer and cut down their Data Engineering time by 500%.

How to Build Your Snowflake Data Stack in One Day
Your Snowflake data stack is the centerpiece of your analytics architecture. In this white paper we will explore what a modern Snowflake data stack looks like, how each component is used, and the key considerations when building one.

How to Transform Your Data for Analytics
Let’s explore the various data modeling and data transformation options to see which approaches work best for your modern cloud data warehouse, such as Snowflake.
10 Steps to Improving Your Snowflake Data Transformations
The first building block of a cloud data stack starts with Snowflake. Your analytics engine and cloud data warehouse is always the core component by which your data stack revolves.
How to Accelerate BI Adoption on Snowflake
Have you spent long evenings and weekends building your data warehouse in Snowflake but are still struggling to get the rest of the organization to adopt it? Here is a sure way to get wider business adoption by getting the business teams involved.
How to Model and Transform Data for Qlik
Learn about the best tools and methods to model and transform your data for Qlik Sense and Qlik apps.

Five Ways DataOps Increases Analytics ROI
While DataOps is a process, it also requires critical capabilities within your data platforms to support it and deliver the promised efficiency, quality, and scale. Let’s explore what DataOps is and five specific ways in which DataOps will increase your analytics ROI.

I-50 Case Study
After researching options, i-5O leveraged Azure to implement scalable machine learning processes and analytics in the cloud and selected Datameer as their Cloud ETL tool to feed data to Azure Synapse.

Akbank Case Study
To deliver the desired agility, Akbank required a big data platform that would consolidate their disparate data sources, speed the time to insight, and eliminate errors.

Data Governance Essentials
See what data governance is, the role it plays in your organizations, and how Spotlight provides key data governance features to support your data operations.
How to Use Snowflake for Agile Analytics
By using agile analytics and data virtualization, your Snowflake projects are faster, more cost-effective, and less risky. This short webinar will discuss the core pillars that will make your Snowflake analytics projects truly agile.
Datameer versus Tableau Prep
Compare Tableau Prep with Datameer and learn how Datameer delivers the same ease of use for enterprise-wide data transformation that covers more use cases and works with all your tools.
What is Data Observability?
Learn about Data Observability and how it improves your DataOps processes and overall data flows.
Maximizing Data Completeness for Accurate Decision Making
Learn how customers use Datameer to maximize their data completeness for in-depth and well-rounded analytics datasets that drive highly accurate decision-making.

What is DataOps?
Learn all about DataOps: what it is, the scope of it, and the critical capabilities required from data pipeline tools and platforms.
Ten Things to Consider When Modernizing Your ETL
Data pipeline, data integration, and ETL tools can vary greatly in their approaches, capabilities, and UX. Use our guide to explore 10 key areas to consider when your modernizing ETL.
How DBRS Morningstar Embraced ETL++ With Datameer
Rahim Jivani, AVP Business Intelligence at DBRS Morningstar walks us through his business case using AWS, Datameer, and Tableau.

Data Governance Technical Brief
Learn the various aspects of the broad subject of data governance, and how Datameer provides the deepest suite of data governance features and capabilities on any ETL, ELT, and data integration platform.

Comparison of Leading ETL and Data Integration Platforms
To ensure your organization is maximizing the value of business data, you need the right data integration solution. See how the leading ETL and ELT platforms stack up.
Datameer and Alation
Learn how Alation and Datameer compare and how they can complement each other to generate even greater analytics ROI.
Comparing Datameer and Dbt
See the comparison between Datameer and Dbt and see how Datameer goes way beyond your standard SQL-based data transformation to deliver better results.

Best Practices for Analytics in the Cloud
GigaOm, a leading independent analyst firm, discusses the cloud data journey, best practices for deploying and using analytics data in the cloud, and evaluates how Datameer can help implement analytics securely and at scale in the cloud.
Datameer and Collibra
Learn how Collibra and Datameer compare and see how the two can complement each other to drive greater analytics ROI.
Have a cloud data warehouse, now what?
Datameer Spotlight is the control that data engineers require and the self-reliance and flexibility that data consumers crave.
National Instruments: Journey to a Data-Driven Organization
Learn how National Instruments selected Datameer to identify and overcome various challenges on their data journey.
Analytics Driving Recruitment of Essential Workers in Covid-19 Crisis
We chatted with Priyanka Khosla, People Insights & Workforce Planning at Sobeys Inc. We discussed people analytics, key metrics, and best practices on how to recruit and hire essential workers during a pandemic efficiently. Watch this webinar to learn more.

Collaborative Analytics
Collaborative analytics increases knowledge around data, facilitates greater trust, brings new ideas on how to use the analytics, and generally produces faster insights with greater detail and accuracy.
Data Preparation
Both data preparation and feature engineering are the most time-consuming and important processes in data mining.

An Essential Guide to Cloud Migration
As if managing data of increasing size weren’t hard enough, organizations are now challenged to monitor business processes, assemble complete views of customers, and weave a cohesive analysis of corporate performance based on hybrid data that are strewn across the traditional enterprise and multiple clouds.
Alteryx Alternative
Top Alteryx Alternative. Alteryx is a 10+ year old software and can be complex to use. It works on your desktop creating more data silos and governance issues.

Data Profiling
Businesses perform data profiling to better understand the condition and the value of their data, making it discoverable and actionable along the way.

Data Mining
Data mining provides several techniques that can help organizations classify this data and try to find patterns or relationships between pieces of data.

Data Catalogs
Enterprise data management is impossible if you can’t manage, access, and process large amounts of data.
AWS Datameer Customer Case Study – PrivacyMaxx
AWS Datameer Customer Case Study – PrivacyMaxx

AWS Datameer Customer Case Study – AI Consumer Debt
AWS Datameer Customer Case Study – AI Consumer Debt

TDWI Cloud Data Management Best Practices
As if managing data of increasing size weren’t hard enough, organizations are challenged to monitor business processes, assemble complete views of customers, and weave a cohesive analysis of corporate performance based on hybrid data strewn across the traditional enterprise and multiple clouds.
Datameer X Datasheet
Explore the comprehensive capabilities and features of Datameer-X in our datasheet, showcasing its advanced data management and analytics solutions for streamlined data processing and insights
Frost & Sullivan Big Data Analytics Award
Frost & Sullivan Big Data Analytics Award
AWS Datameer Customer Case Study – Retailer
AWS Datameer Customer Case Study – Retailer
AWS Datameer Customer Case Study – Investment Bank
AWS Datameer Customer Case Study – Investment Bank
Agile Data Pipelines for Cloud Machine Learning
With the agility and scalability of a modern data platform, analytics teams can make better decisions and provide faster results.

Agile Data Pipelines for Cloud Data Warehouses
Cloud data warehouses give business teams the ability to deliver more analytic value faster than ever. Download this brief for more.
451 Research – Self Service Data Preparation & Pipelines Business Information Brief
451 Research Business Information Brief

Vivint Customer Case Study
Intelligence is the center of the smart home and Vivint is using Datameer to shorten the time it takes to go from raw data to actionable intelligence that can be used to enhance their customer’s home experience.

Sophos Customer Case Study
Sophos investigated various data platforms and technologies available at the time and choose Datameer to be a core platform component for their telemetry and threat correlation analytics.

BT Openreach Customer Case Study
BT Openreach turned to Datameer to solve their unique and challenging operational analytics problems. The resulting solution used best of breed capabilities from the Datameer platform that were integrated seamlessly into their infrastructure solution to deliver rich network service analytics to the BT Openreach operational team.
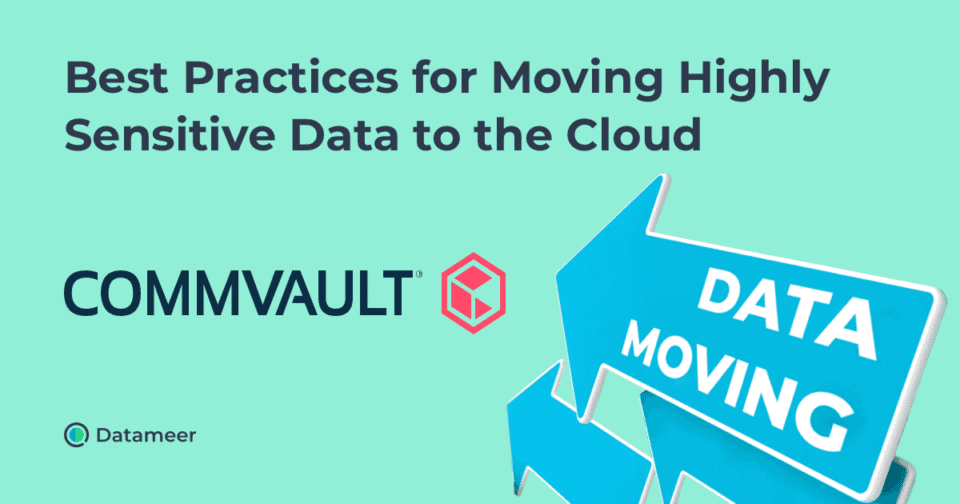
Best Practices for Moving Highly Sensitive Data to the Cloud
Our guest Patrick McGrath, Director of Product Management, Search & Analytics at Commvault, talked about the best practices for moving sensitive data to the cloud.
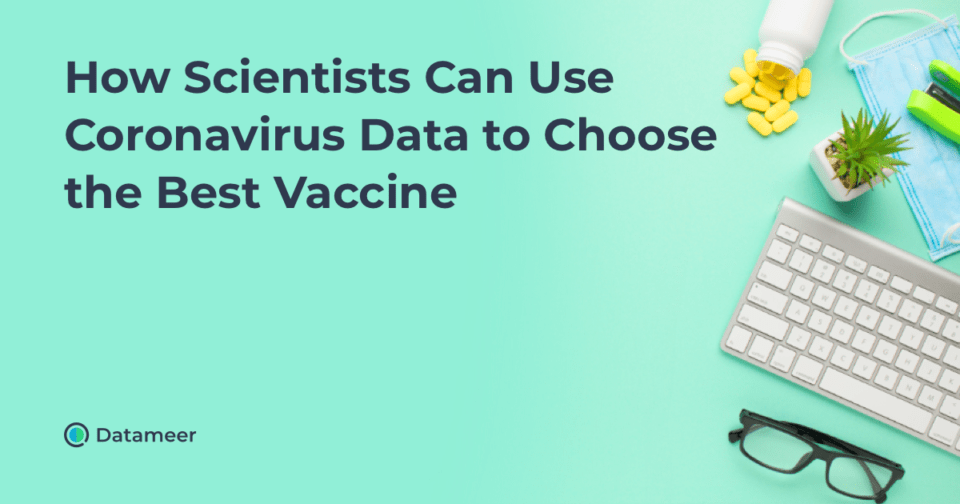
Scores of Coronavirus Vaccines are in Competition — How Will Scientists Choose the Best?
Join Nikhil Kumar and Steve Egan while looking at coronavirus data from 3 different drug clinical trial data, add patients’ demographics and comorbidity data, and solve which drug might be the most effective against Covid-19.
Leveraging Data to Prevent Financial Fraud
Learn how a financial firm accessed hard-to-get data and brought it all together ‘virtually, using data to prevent financial fraud.
How an Auto Insurer Uses Data on Driver Behaviors to Adjust Premiums
Join our webinar to find out how one of America’s top auto-insurer used Spotlight to create a virtual analytics hub that enabled data scientists to quickly and easily find, gain access, and run advanced analytics on their disparate data landscape.
The Fastest Way to Migrate to the Cloud
Join Frank Henze on how to migrate some or all of your analytics and data science workloads to the cloud with ease while also enabling teams to run their data science projects across hybrid and multi-cloud landscapes.
Successful Approaches to Cloud Analytics
Join us in a discussion with Andrew Brust. He advises customers on analytics strategies, writes about Big Data for ZDNet and GigaOm, co-chairs a series of developer conferences the Visual Studio Live!, and is an influencer in the Microsoft ecosystem, recognized as both a Microsoft Regional Director and Data Platform MVP.
Agile Delivery of New Cloud Analytics
Join John Morrell and Steve Egan for this empowering webinar on how to gain faster analytics for your business, more excellent analytics teams’ productivity and more significant ROI on analytics initiatives.
Analytics Opportunities for Retail in 2020
In discussion with Gary Angel, CEO of Digital Mortar and long-time retail digital analytics thought-leader, we discuss retail industry analytics and its challenges. Watch this webinar to hear more.
Design Patterns for Data Preparation using Datameer
While each use case may be unique, many common design patterns can be used for data preparation in data pipelines that curate data for analysis. Let’s explore these and see how you can apply them.
Data Preparation & Pipelines for Data Science using Datameer
Learn how you can use advanced data preparation and exploration to explore your data to determine fit, rapidly shape your data for AI and ML engines, and deploy data pipelines to create a cooperative workflow with AI and ML tools.

The Ultimate Combination of Power, Reliability, and Agility on Azure
Organizations that use the AWS ecosystem rely on Datameer’s self-service solutions to pipeline data to the cloud faster, search and perform petabyte-scale analytics across complex data landscapes, and unlock more insights from all their data.

Self-Reliant Solutions for Trusted Analytics on Google Cloud Platform
With Datameer and Google Cloud Platform, analytic teams are completely self-reliant. Teams discover data, analyze it in minutes, and invest their time in what they do best – on the data-driven decisions that advance your business.

Your Solution for Trusted Analytics Environments on AWS
Organizations that use the AWS ecosystem rely on Datameer’s self-reliant solutions to pipeline data to the cloud faster, search and perform petabyte-scale analytics across complex data landscapes, and unlock more insights from all their data.

Access Over 200 New Data Sources for Tableau Workbooks Without a Data Warehouse
Access data for your Tableau dashboards that you never could before, including Facebook Ads, Workday, Twitter Ads, Hubspot, Shopify, Dynamics, SAP Concur, and so much more. No data warehouse necessary. No data engineering is required.
Increasing Analytics Teams Productivity
Join Bob Page, Datameer Spotlight Chief Product Officer, and Steve Egan, our Data & Analytics Solutions Engineer, on how to empower your analytics team to discover, and find any data in the enterprise, collaborate, and perform ad-hoc analytics with any BI or data science tool.
Evolving Your Regulatory Compliance
The right tools can enable a company to move quickly from regulatory compliance success to strategic data excellence in months. Datameer has helped enterprises around the world scale their regulatory data operationalization efforts to do just that.

Telecom Network Capacity Planning
As part of its impressive growth and expansion, a global telecommunications company needed to roll out a new content delivery network for a high-growth offering: high-speed video player services. Management made an initial investment in network infrastructure, rolling out limited amounts of upgraded bandwidth in strategic geographies.
The Leading No-Code Airflow Alternative
Airflow is a general-purpose, open-source workflow tool that is used as a data orchestration tool to define and coordinate analytics data pipelines. Airflow has some similar objectives as Datameer. Your target is often a cloud data warehouse such as a Snowflake, and it allows you to apply software engineering best practices to process the data. The similarities end there.

Evolving Your Analytics with Big Data
Big data analytics enables you to answer a new generation of questions to become an agile business and allows the BI and analytics team to deliver more insights to your organization.

Using Customer Behavior Analytics to Increase Revenue
Customer behavior analytics maximizes the value of customer relationships by identifying actionable insights that drive valuable outcomes. Whether to acquire new customers, better engage, or retain existing ones or increase loyalty, customer behavior analytics is the fundamental core to make those initiatives successful.
Best Practices for Creating an Optimal Data Lake
Big data can only get bigger. Data lakes help you manage data in all forms, shapes, and sizes. But how do you get more value from all this data?

Financial Services Cultivating Customer Relationships
Financial services institutions are under continuous pressure to identify ways to grow their revenue and assets under management. At the same time, competitive threats abound as financial services firms of all types compete for customers and their wallet share.

Getting GDPR Compliant with Your Big Data Analytics
With a great deal of personal data being used in big data analytics, you must choose a platform that provides the deepest functionality to ensure you are GDPR compliant while still lowering the administrative burden needed to manage compliance processes. Datameer fits the bill.
Big Data Analytics: Financial Services Regulatory Compliance
Datameer’s big data analytics platform provides the right combination of power, speed, and flexibility required to navigate the unpredictable waves of financial services regulatory compliance requirements successfully.

Retail Use Cases for Enterprise
An effective data engineering platform can help retailers harness this vast amount of data to optimize the customer experience, increase sales across all channels, and make merchandising a data-driven process.

Telecom Service Customer Experience
Big data analytics combines and analyzes data related to customer interactions, innovation, service execution, and network performance, providing a 360-degree service experience view. This process allows winning CSPs to retain and grow their customer base, increase service utilization, and raise customer lifetime value (LTV).

Anti Money Laundering
Datameer’s analytics platform provides the right combination of power, speed, and flexibility required to successfully navigate the unpredictable waves of financial services compliance requirements. Learn more about our work in financial services or sign up to attend a live demo.

Top Six Telecommunications Big Data Use Cases
Explore Big Data Use Cases and See How Big Data Analytics Can Transform Operations, Enhance Customer Experiences, and Boost the Bottom Line.

Defining the Value of Big Data Customer Analytics
Customer analytics, driven by big data, can transform the buyer-seller relationship. It’s not simply about gaining deeper insights about customers but using that data to drive more effective personalized marketing, increasing sales productivity, and retaining customers for a higher lifetime value.

Governance Best Practices
We examined several different approaches and architectures for governance best practices. Choose the right approach for the unique needs of your organization, data, analytics, and business teams. With Datameer, you can mix and match these models to fit individual needs with departments or business units.