
From Snowflake to Looker: A Step-by-Step Guide to Efficient Data Migration
In a modern data-driven business landscape, efficient and effective data transformation is not merely an option; it’s a necessity. One such critical transformation journey ...
- Ndz Anthony
- July 1, 2023

How Looker Stacks Up Against BI Competitors
Chances are you’re familiar with leading business intelligence (BI) platforms like Tableau and Power BI, two Looker competitors. Looker , a BI tool that’s quickly growing i...
- Justin Reynolds
- January 28, 2020

How to show the column value labels in thousands without changing the value label format for % change in Looker?
This tutorial addresses how to show the column value labels in thousands without changing the value label format for % change in a Looker dashboard. SOLUTION : Go to “Y-Axi...
- Datameer, Inc.
- February 1, 2018
How to allow dimension/measure tooltip in Looker to show the description to user when pointing over name of the object in a Look (Table)?
We can enable tooltip for dimensions and measures by adding descriptions in their respective LookMLs. Please consider the examples below: measure: gross_margin { descript...
- Datameer, Inc.
- January 25, 2018
How to use a dimension from another view in Looker?
We can use a substitution operator ($) to reference dimensions and measures from other views in LookML. Consider the following code where we have two views, example_A and e...
- Datameer, Inc.
- January 25, 2018
How to do conditional formatting of color or images within table cells using HTML in Looker?
Please consider there is a field called order_status , which gives the status of each order. The possible values for order_status can be: order_is_paid order_is_shipped ord...
- Datameer, Inc.
- January 25, 2018
How to change the order of stacks in a stacked area chart in Looker?
A stacked area chart is an extension of a basic area chart. It is used to group values of multiple dimensions on the same graph. The values of each dimension are displayed ...
- Datameer, Inc.
- January 25, 2018
How to do time zone conversions for Microsoft SQL Server databases using Looker?
From Looker v6.22 and MS SQL Server 2016 version onwards, Looker has started supporting time zone conversions for Microsoft SQL Server databases. Hence you would use the sa...
- Datameer, Inc.
- January 25, 2018
What is the most efficient way in Looker to use table calc functions to do aggregates based on a separate dimension column?
The Problem Is there an efficient way to use table calculation functions to do aggregates based on a separate dimension column that could take on arbitrary values (similar...
- Datameer, Inc.
- January 24, 2018
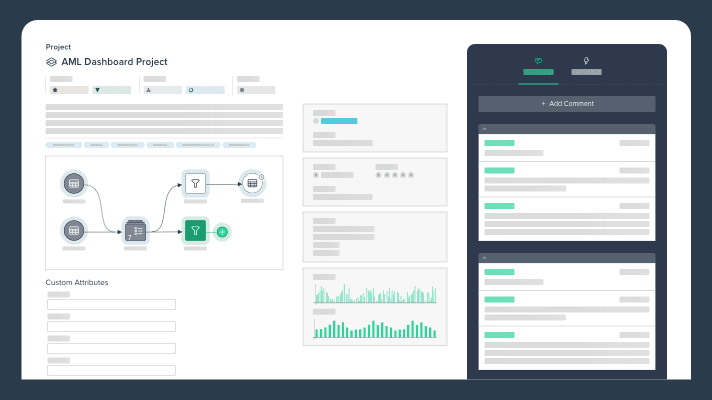
Where can I find examples of dashboards that others have built in Looker?
A dashboard is an executive view of multiple visualizations arranged logically. These visualizations result from different queries generated by Looker. To render the dashbo...
- Datameer, Inc.
- January 24, 2018
How to comment on an entire block of code in the LookML editor of Looker.
In Looker, one can follow the below instructions to comment a block of code in LookML editor : Select the lines which are required to be commented out. Press ⌘ + / on a Ma...
- Datameer, Inc.
- January 22, 2018
How to capture the count of records for a date between two dates in Looker?
Assuming that the Date Dimension is already created, this can be achieved by creating count measures in the LookML of the same view where Date dimension exists: Count Disti...
- Datameer, Inc.
- January 22, 2018