Visual SQL for Analytics Engineers
- Ndz Anthony
- December 27, 2022
Are you a data engineer, a data analyst, or better, an analytics engineer?… Then this article will be invaluable to you.
This article will explore the concept of SQL visualization and its benefits to the modern-day analytics engineer.
They say every good question starts with a “who,” so …
Who are Analytics Engineers?
Analytics engineers are in-demand professionals responsible for analyzing data and finding insights. They work with various industry personas to help them drive better decision-making with analytics.
Analytics Engineers frequently collaborate with data analysts, project managers, and business intelligence specialists to provide insights into the company’s operations.
How Analytics Engineers Work with Data
As we pointed out, analytics engineers work with data to solve business problems. Their processes help to bridge the gap between data and information in an organization.
Analytics Engineers are primarily responsible for building analytics models, conducting data analysis, and monitoring data pipelines. They also help find the root cause of data problems by identifying patterns via data lineage, metadata tracking, etc.
You can read more about tips and tricks for data lineaging with Snowflake here.
What Is SQL Visualization?
SQL Visualization means precisely what you think it means.
Not writing SQL and subsequently building out charts.
Not augmented SQL writing.
This refers to representing SQL code in a graphical form.
You may be wondering why do I need to visualize SQL?… I mean, it’s called a query “language” for a reason 🙄
Well…let’s explore this in the next section.
The Why Of SQL Visualization
It’s known that a human gets the sense of a visual scene in less than 1/10 of a second.
This makes SQL visualization very effective because it takes advantage of the psychological tendencies that influence visual cognition.
Imagine staring at blocks of SQL code to try to make sense of it.
I’m sure you didn’t have to stretch your imagination that wide; you’re probably familiar with this struggle already…And that’s why you need SQL visualization.
A few additional reasons are:
- Visual SQL offers a fast and modern way to make sense of data in your repositories.
- SQL visualization tools help users to visualize data in a better way than traditional SQL queries. These tools are designed for the end user and the engineer persona, making them easy to use, interactive, and generally easier to share.
- SQL Visualization is easy to follow, and some SQL Viz tools have data lineage features, join suggestions, and can show metadata on certain data assets.
3 Things To Consider When Selecting A SQL Visualization Tool For Snowflake
With the advent of modern analytics, self-service data preparation is becoming increasingly prevalent.
For businesses with analytics engineering resources, this presents a unique opportunity for the downstream end-users and the technology to be brought together under a governance framework that balances IT control with the flexibility and agility the business needs.
SQL visualization is one tool used by analytics engineers to enhance this self-service framework.
At this point, I’m hoping you’re convinced that you want to try one of these out.
Here are four things you should consider before selecting a SQL Visualization tool:
-
Not all SQL Visualization Solutions are Created Equal:
Installing and deploying a lot of data analytics software can be very difficult, and maintaining and optimizing frequently takes a lot of time for IT and data teams.
Users benefit from cloud analytics SQL Viz solutions in the following ways;
- Simplicity in adoption and onboarding
- Reduced costs of analytics infrastructure- With cloud analytics, your company only requires connectivity, and you can start deploying and scaling your cloud solution immediately.
- Swift setup times- deployment time can be shortened by having the entire team operational in minutes.
2. User Experience:
In e-commerce, stats cite that about 88 percent of online shoppers won’t return to a site after a bad UX experience.
The same goes for SQL Viz tools. A SQL Viz tool without an intuitive interface is counter-productive. It defeats the purpose of SQL visualization – representing SQL in a visual, appealing, and intuitive format.
3. Collaborative Features :
Have you ever heard the phrase – ” A data problem shared is a problem half solved”? Still trying to figure out how it goes, but you get the idea.
A significant pillar in modern-day self-service and data democratization is collaboration.
When data is shared amongst teams and departments, the value of data grows.
A SQL visualization tool should come pre-built with collaboration features to ensure proper, decentralized data preparation.
Categories Of SQL Visualization tools For Snowflake Engineers
There are different data-visualization tools for your Snowflake SQL, ranging from paid to free tools.
Each has a distinct approach to SQL and data visualization, so what works for one organization may not work for another.
In this section, we want to highlight our top 3 recommendations for Snowflake SQL visualization.
1. Visual DB modeling tools:
A database model shows the logical structure of a database, including the relationships and constraints that determine how data can be stored and accessed. A visual DB model tool helps DB modelers do just that- except in a fast way!
One can graphically design DDL operations with advanced inter-relations without ever leaving the Snowflake environment.
An excellent example of such a tool is SQL Dbm.
2. 3rd-party BI Tools:
There are many Snowflake BI tools, including Power BI, Tableau, and Metabase, to name a few.
Most of these non-native tools connect to Snowflake via ODBC and JDBC-type connections and then query the data before visualizing the SQL query.
A good example is Tableau’s data prep.
3. Visual Data wrangling tools:
Unlike the 3rd-party BI tools that require importing the query or at least virtually querying it before performing SQL visualization. There are SQL visualization tools for native Snowflake data wrangling.
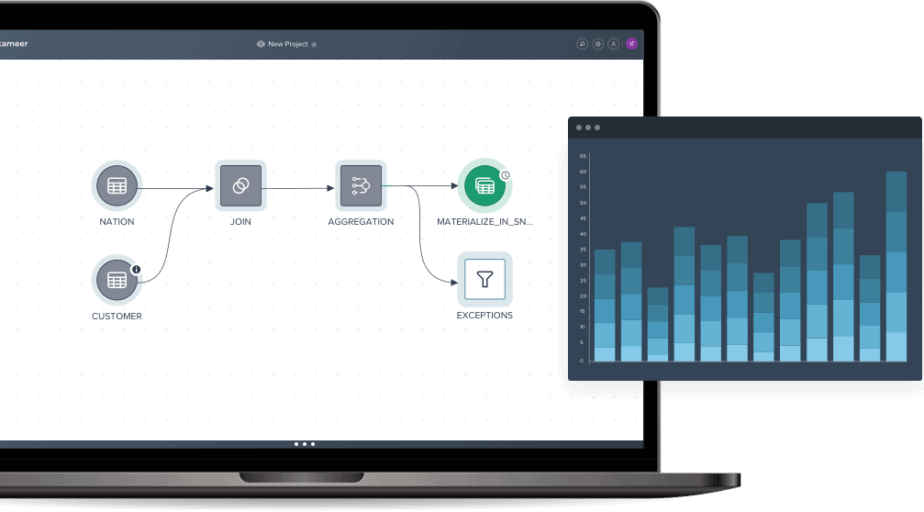
To get a complete picture and extract the required knowledge from your data, you need to be able to perform transformations on your Snowflake data in real time. Datameer is one such tool.
Datameer combines integrated self-service data with insights and visualization abilities to build a solid solution…
Supercharge Your Snowflake Analytics With Datameer!
Datameer is the analytics engineer’s top tool for transforming and modeling Snowflake datasets.
It provides a graphical representation of the data and allows you to wrangle, perform ad-hoc analysis and derive insights from your data.
It has GUI features that allow users to interact with the data and filter, sort, join and assign aliases without writing a single line of code.
It also empowers you to schedule your flows in a centralized, scalable, and reliable cloud environment, so your data is always up to date. It also gives administrators visibility into self-service data preparation across their organization.
Other features include:
- Documentation
- Close-knit Integration with Snowflake
- Collaboration features, to name a few
Still not convinced?
Access our free 14-day trial and see for yourself.


