Excel Data Transformation: A How-To Guide For Smarter Results
- Jeffrey Agadumo
- February 14, 2023
This article outlines methods and tools for Excel data transformation and provides a pictorial guide for each technique or tool listed.
Excel is famous for organizing, formatting, and performing calculations on related data in spreadsheets. And if you use Excel well enough, you’ve probably dealt with incomplete and inconsistent data tables before.
We’ve come to the rescue with this all inclusive guide to format and structure unclean data in your Excel spreadsheets effectively.
What is Data Transformation?
Data transformation involves processes that alter data structure, format, and sometimes data values to improve quality.
Such processes typically include cleaning, mapping, aggregating, and reformatting data to meet specific requirements or to support specific use cases.
Data transformation aims to make data easier to understand, use, and share.
We can classify transformation processes under the following types:
- Constructive Transformation: Includes adding, replicating, and copying data.
- Destructive Transformation: Deleting fields or tables of data.
- Structural Transformation: Includes moving, combining, and renaming columns in our tables.
- Aesthetic Transformation: Involves the standardization of data to give it a uniform standard
A More Robust Alternative
When working with larger and more consistent data sets, the need arises for a different transformation tool that is easier to use, more capable of handling your data load and offers more robust functionalities for transforming raw data into meaningful insights.
Datameer provides a structure and interface that allows you to visually explore, build and automate your data transformations using SQL or No Code options.
Features of Datameer that make it a suitable tool for data transformation include:
- Supports all Data Formats : Datameer automates the transformation operations of your data in Snowflake , which can store structured, semi-structured, and unstructured data formats.
- Highly Scalable : Datameer can handle increasing amounts of data and users without sacrificing performance or speed.
- Fosters Collaboration: Datameer is a highly collaborative tool that enables all team members to monitor, transform and update data in the same place.
- Cloud Hosted: Datameer is designed to transform data in Snowflake, meaning all data is automatically stored on Snowflake cloud and updated in real time.
Some alternate instances for transforming data with Datameer include :
- Performing aggregate functions on data with Datameer.
https://www.datameer.com/demo-center/aggregate-transformations-with-datameer/
- Creating pivot tables for data in Datameer.
https://www.datameer.com/demo-center/pivot-data-in-datameer/
Visit the Datameer demo center now to explore the simplest no-code data transformation methods with robust options and no shortcomings.
Some Transformation Options in Excel
Excel is an excellent tool for analyzing and reporting a business’s data. Still, that data needs to be transformed and aggregated, especially if new statistical fields are created in the table.
When it comes to transforming data in excel, there are a couple of options that you can use to get the job done:
Excel Functions
Functions in Excel are pre-built formulas that perform specific calculations. They take inputs (arguments), perform an operation and return a result.
Several Excel functions can perform data transformation operations in your tables.
They include:
- Date and Time functions: These functions manipulate the date and time, or date, and perform related calculations based on inputs provided.
- NETWORKDAYS(): returns the number of workdays between two dates.
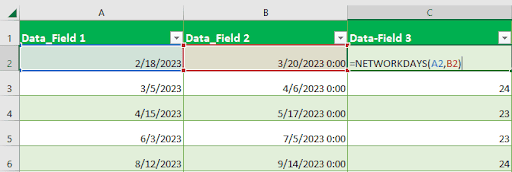
Double-click a cell and type the function name -preceded by an equals sign – with the start and end dates as parameters.
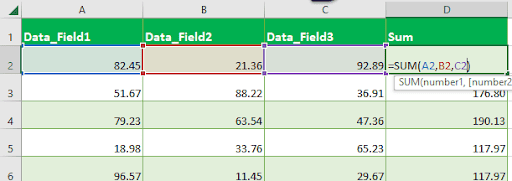
- Aggregate functions are functions that perform a calculation on a range of cells and return a single result. They are typically used for converting large sets of numeric data into smaller sets of statistical data.
- SUM: calculates the sum of a range of numbers.
-
- AVERAGE: calculates the average of a range of numbers.
![]()
-
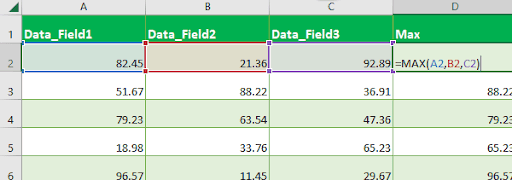
- MAX: returns the highest value in a range of numbers.
Another function that transforms the format and structure of the data tables is:
- TRANSPOSE: This allows you to rotate or flip the orientation of a range of cells. That is, it takes a range of rows in a table and changes it to columns of the same range or vice versa.
Power Query
Power Query is a tool for extracting data from various sources, transforming them, and loading the transformed data into other data stores. It is a valuable tool for ETL in Excel.
To get started with Power Query:
Step 1: Open up Excel and click on the “Data” tab in the ribbon.
Step 2: Click on the “Get Data” button in the “Get & Transform Data” group.
![]()
Step 3: Choose the data source you want to connect to, such as an Excel workbook, a database, or a web page.
Step 4: Click the “Transform Data” button to open Power Query Editor.
![]()
Step 5: Once connected, you can start transforming the data using the Power Query Editor.
![]()
When you are finished transforming the data, click the “Close & Load” button to load the data into an Excel worksheet for analysis.
For additional resources on Power Query, click here .
Power Pivot
Power Pivot is a data analysis tool that allows you to work with large amounts of data and create advanced data models using an SQL-like interface.
It allows you to create relationships between tables and summarize and analyze all data tables into pivot tables and charts.
You can access Power Pivot using the following steps:
Step 1: Open Excel and click on the “File” menu.
![]()
Step 2: Choose “Options” and then “Add-ins.
![]()
Step 3: In the “Manage” box, select COM Add-ins” and click “Go.”
Step 4: Check the box next to “Microsoft Power Pivot for Excel.
Step 5: Click “OK” to enable Power Pivot in Excel.
To access Power Pivot, go to the “Data” tab in the ribbon and click on the “Manage Data Model” button in the “Analysis” group.
You can now use Power Pivot to connect to data sources, create relationships between tables, build calculated fields and pivot tables, and perform other advanced data analysis tasks.
You can also check out more on Power Pivot here .
Macros and VBA
A macro in Excel is a series of recorded steps or commands that automate repetitive tasks. Macros can be used to format and perform calculations on data. To create a macro in Excel, follow the outlined steps:
Step 1: Open Excel and click on the “Developer” tab in the ribbon.
![]()
Step 2: Click the “Record Macro” button in the “Code” group.
![]()
Step 3: Give the macro a name, assign a keyboard shortcut if desired, and click ok to start recording.
![]()
Step 4: Record the macro steps and click the “Stop Recording” button in the “Code” group to stop recording the macro.
Also!
VBA (Visual Basic for Applications) is a programming language used in Excel to perform more complex operations in Excel. VBA allows you to write code to automate repetitive tasks and create custom solutions. It also allows you to edit the steps taken in a macro to make it more adaptive to your use case.
You can find both VBA and Macros in the developer tab of the ribbon.
Once there:
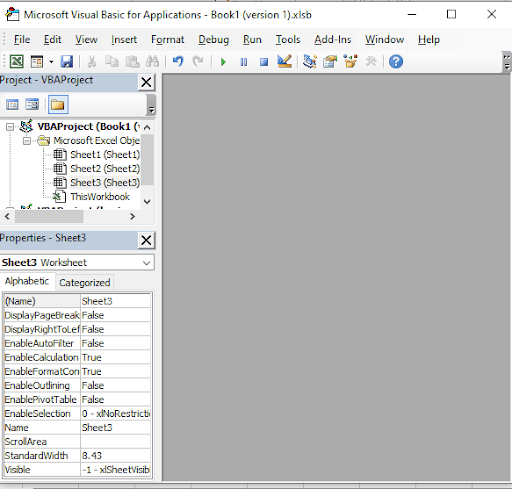
1. Click on the “Visual Basic” button in the “Code” group to open the VBA editor.
![]()
2. In the VBA editor, you can write code, create new modules, and access the Excel object model.
3. To run a VBA macro, press the “F5” key or click the “Run” button in the VBA editor.
Shortcomings of Excel Data Transformation
Granted, Excel is a reliable tool that can enable us to perform transformation operations on data. However, it has limitations to how well it can be utilized in an ETL pipeline.
Such limitations include the following:
1. Does not Support Unstructured Format:
While Excel has methods and stools that make it capable of performing transformation processes on data tables, it could be better at sorting and analyzing unstructured data.
2. Limited scalability:
Excel is designed for working with relatively small datasets, and its performance can start to degrade as the size of your data increases. This can make it challenging to work with large datasets, mainly when performing complex transformations.
3. Limited Collaboration:
Excel is typically suited to single users as it does not allow multiple users to edit the same document simultaneously and easily share documents.
This can make collaborating with others on a data transformation project difficult.
4. No Real-Time Updates:
Excel cannot handle data that will need to be transformed and analyzed consistently – like stream processing . It can become a hassle to upload to a data warehouse constantly.
Storing it locally could also pose some data security risks.


