Top 6 Snowflake Reporting Tools in 2023 (Updated)
- Ndz Anthony
- October 25, 2022
In this article, we have curated an updated list of our top 6 Snowflake reporting tools for 2023.
Before diving deep into the detail of each tool, here’s a quick list of the best reporting and BI tools for Snowflake in the following categories as per your need:
- Best-in-budget: Power Bi
- Free: Metabase
- Non-technical: Qlik
- Beginner friendly: Looker
- For Experts: Tableau
- Simple Ad-hoc: Datameer
Why Snowflake Reporting?
According to the 2020 cloud computing trends report, a group of 750 tech professionals has claimed that 93% of respondents have adopted cloud-based data warehouses; in contrast, only 87% implemented the hybrid cloud approach strategy.
From the above fact, it is evident that using a cloud-based data warehouse like Snowflake is the best decision any data-driven business can make for intelligently managing their data.
Snowflake is a cloud-based data warehouse as-a-service deployed on cloud platforms such as Amazon web services (AWS) infrastructure, GCP, and Azure.
Snowflake is the only SaaS platform that doubles as a data warehouse as well as a data cloud platform.
According to a blog by cloud experts, faction, one of the critical characteristics of every data warehouse is the ability to provide access to reporting BI tools.
Snowflake is no exception.
However, we know this is a highly competitive market, and choosing the befitting reporting tool might sometimes be challenging.
Top 6 Snowflake Reporting Tools in 2023
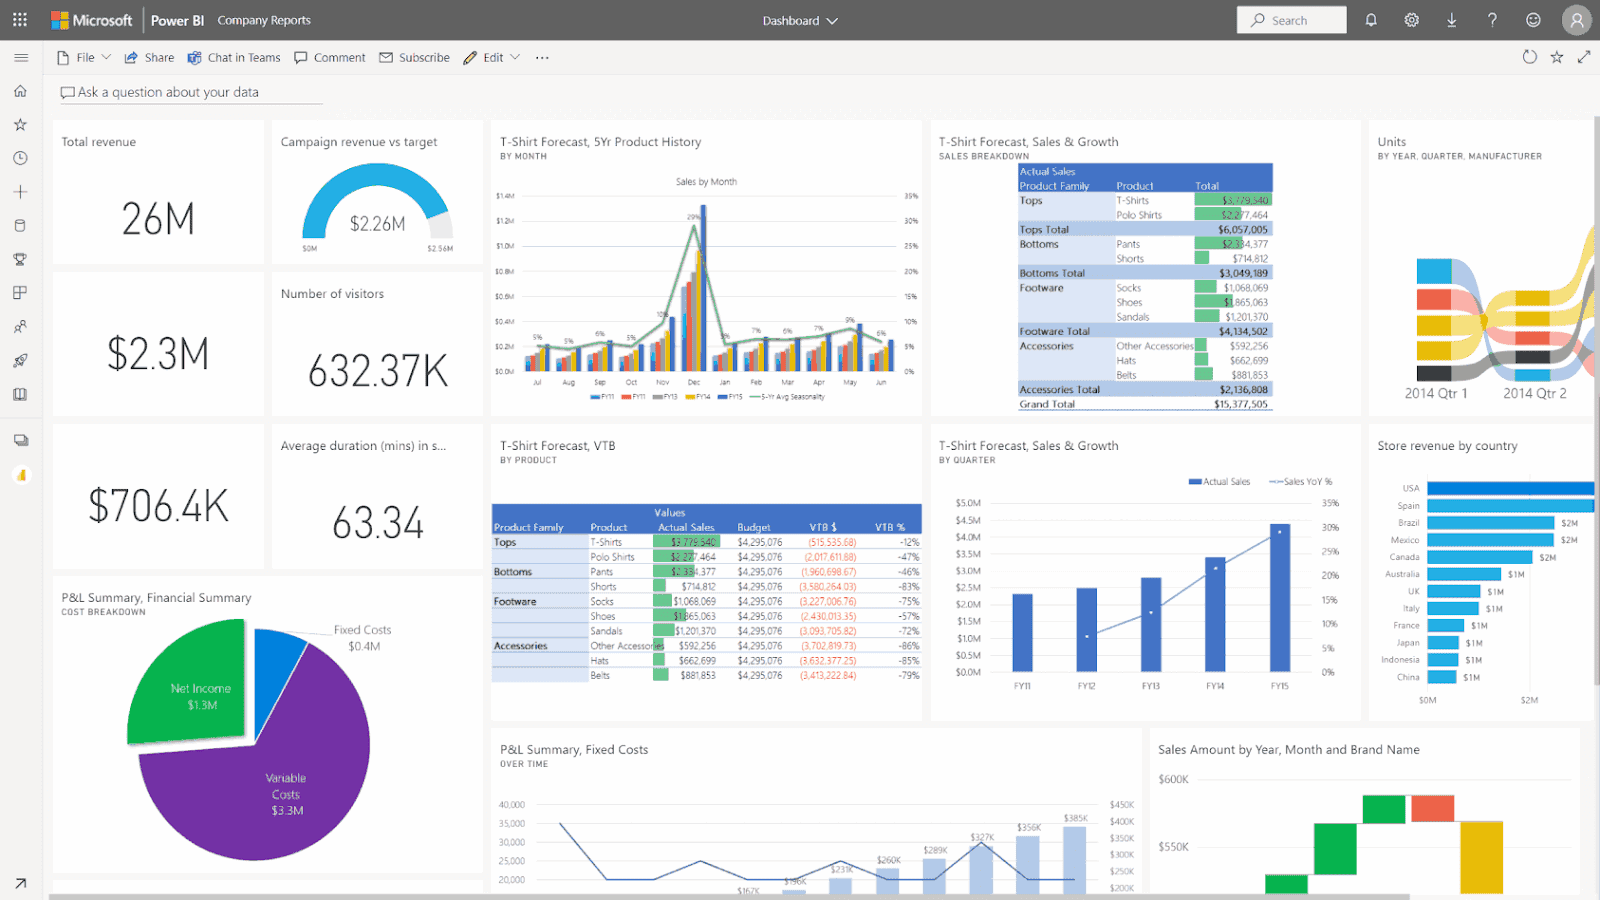
1. Power Bi
Power Bi is the perfect mix of business analytics and data visualization tool provided by Microsoft for converting raw informal data into beautiful reports and dashboards.
With the help of this tool, any individual, team, or organization can extract actionable insights from the raw data by analyzing & visualizing it to make data-driven decisions.
Pros:
- It integrates seamlessly with hundreds of data sources and cloud platforms like Snowflake.
- Provides a streaming user experience with the help of customized dashboards & reports for identifying the most important KPIs of your business.
- It has two types of versions, i.e., free and paid, and fits best in the budget for most marketers and data analysts.
Cons:
- It seems to be overcrowded & having a clunky user interface, which makes it less beginner friendly.
- It does not provide a data-cleansing solution.
- Performance issues when importing the big datasets in Power Bi.
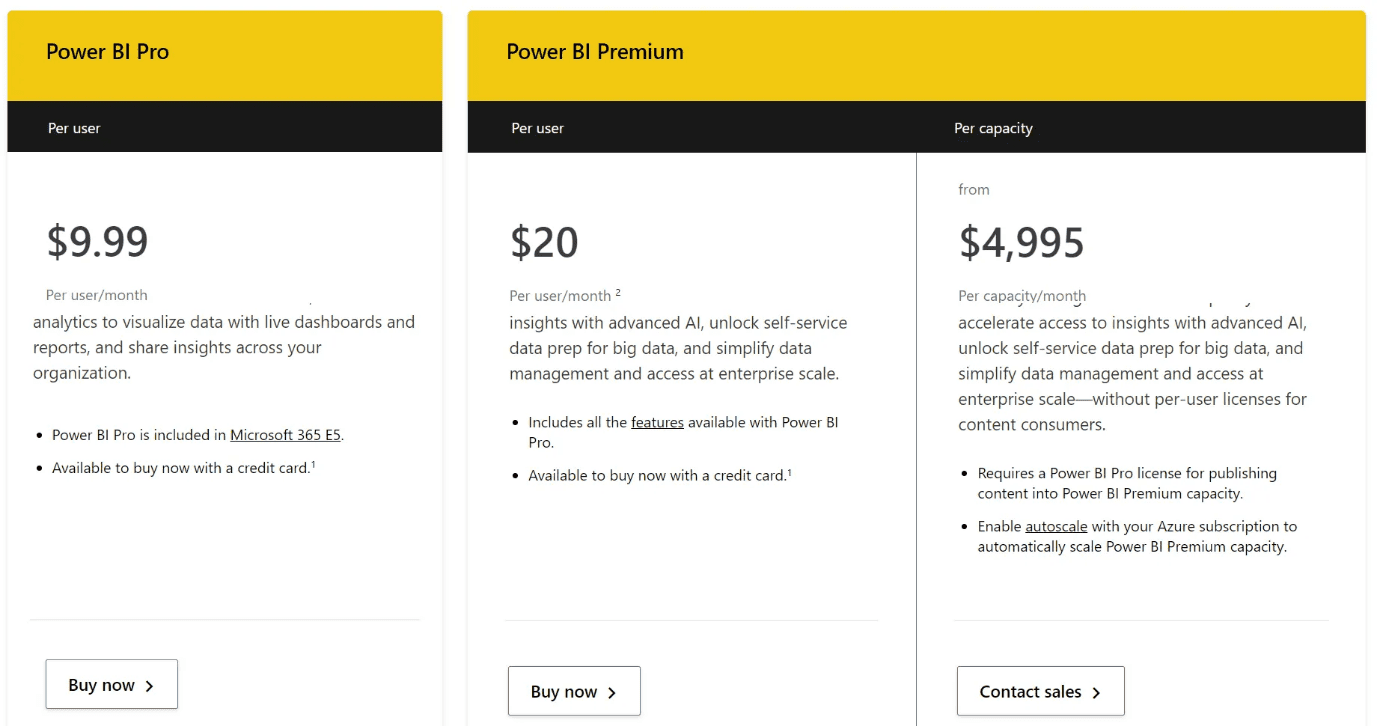
Pricing:
Guide for connecting Power Bi to Snowflake
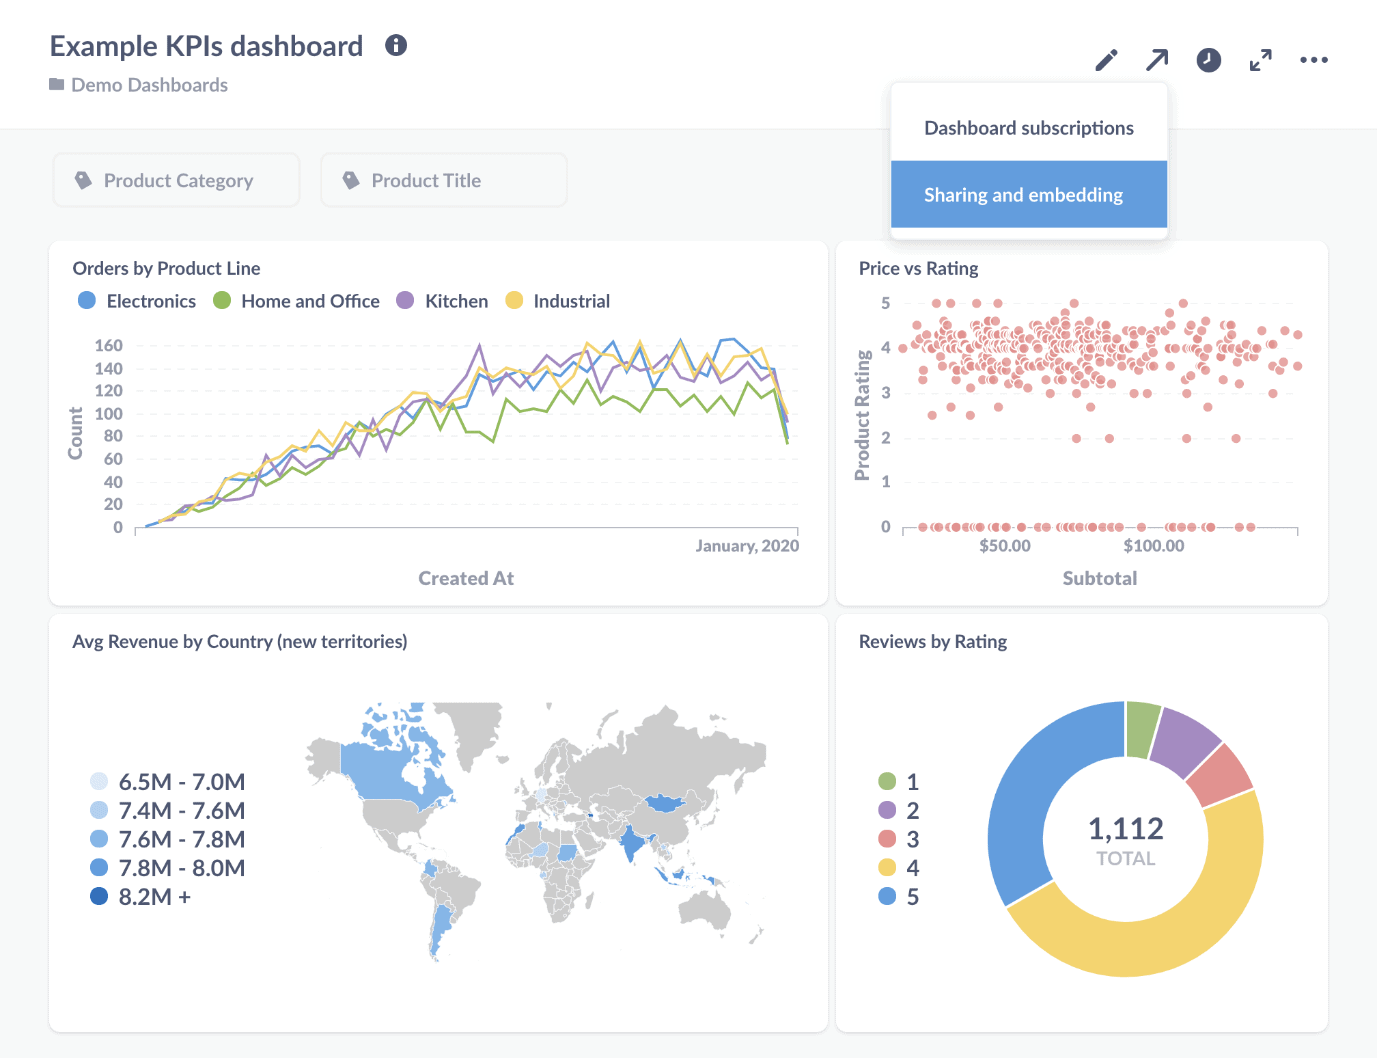
2. Metabase
It is free and one of the best open-source business intelligence tools for creating various charts, reports, and dashboards with no or minimal use of SQL.
So, if your team doesn’t have an SQL expert but a few good analysts and experts, you might want to check this tool out.
Pros:
- It is an excellent tool for setting up simple and fast processes for analyzing data.
- It has an excellent user-friendly interface that allows one to use this tool without prior knowledge of SQL.
- Metabase is licensed under GPLv3 with source code available on GitHub.
Cons:
- Some essential analysis tools like predictive analytics, performance metrics, and benchmarking are lacking.
- Since Metabase is a single SQL data source, you can’t join the data from various sources.
- No desktop version is available for Metabase.
Guide for connecting Metabase with Snowflake
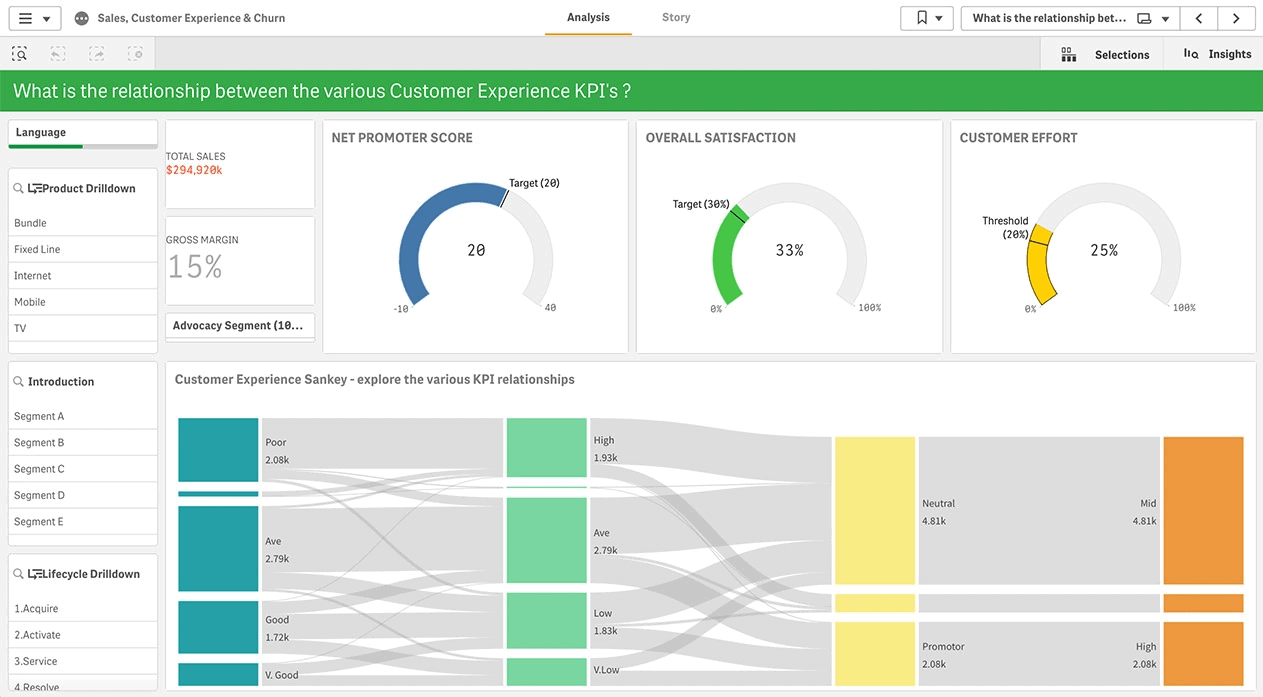
3. Qlik
This reporting tool delivers the best enterprises’ cloud analytics solutions that help businesses to make more meaningful decisions and insights around their data.
It is an end-to-end platform that combines business intelligence, data visualization, and data integration with powerful cloud-based data platforms like Snowflake.
Pros:
- Easy to set up filters for different charts and visuals, enabling the user to analyze the specific time range of data.
- Supports data imports from various sources and almost every cloud-based data warehouse platform, including Snowflake.
- Unmatchable loading speed and faster processing of even large sets of data.
Cons:
- Sometimes unintentional combining of data aspects will occur while filtering out the data.
- The syntax is not clear, and the expression formulas look unusual.
- No ability to union bookmark results together.
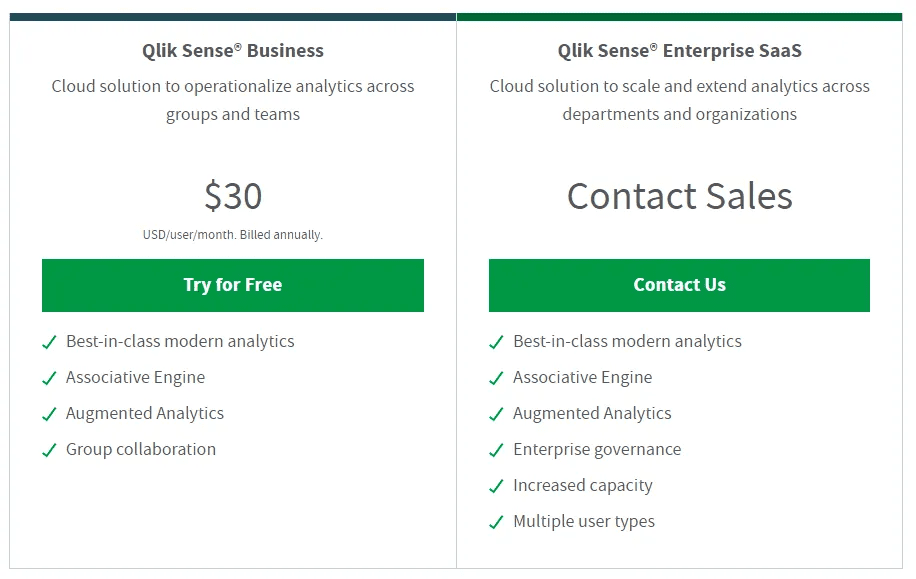
Pricing:
Guide for connecting Qlik with Snowflake
4. Looker –
A Bi tool that is powerful, easy to understand, and provides an innovative approach for real-time data exploration and analytics.
Looker, previously known as Google Data Studio, has recently become part of a Google Cloud Platform. Like other Snowflake tools here, this tool is also ideal for delivering enterprises level of business intelligence to your organization.
Pros:
- Most accessible reporting tool to learn and make actionable dashboards without any prior knowledge of coding skills or any programming language.
- It is developed as part of the Google Analytics Suite, fully integrated with the other relevant Google products.
- Looker runs entirely on the browser, so there’s no need for a desktop or any software install.
Cons:
- It is the least flexible tool of all the tools on this list.
- There is no option to add custom visuals, only to modify the existing ones to some extent.
- The data must be ready for visualization, and only minor changes can be made.
Guide for connecting Looker with Snowflake
5. Tableau
Tableau is currently the fastest-growing BI tool in 2022 because of its high customization capabilities, and decision-makers are loving it worldwide.
Tableau allows companies to customize their visualizations through easy-to-use modeling tools.
Pros:
- It has drag-n-drop functionality, which allows it to create a powerful and interactive dashboard within minutes.
- Tableau can easily handle millions of rows and data columns without impacting the dashboard’s performance.
- Dashboards built in Tableau are responsive in each device category, whether a mobile phone, PC, or mac.
Cons:
- The automatic refreshing or scheduling of report feature is unavailable in Tableau.
- Initial data preparation is required (Structured data).
- Features may seem too specialized and restricting, though Tableau is intended for broader use.
Pricing:
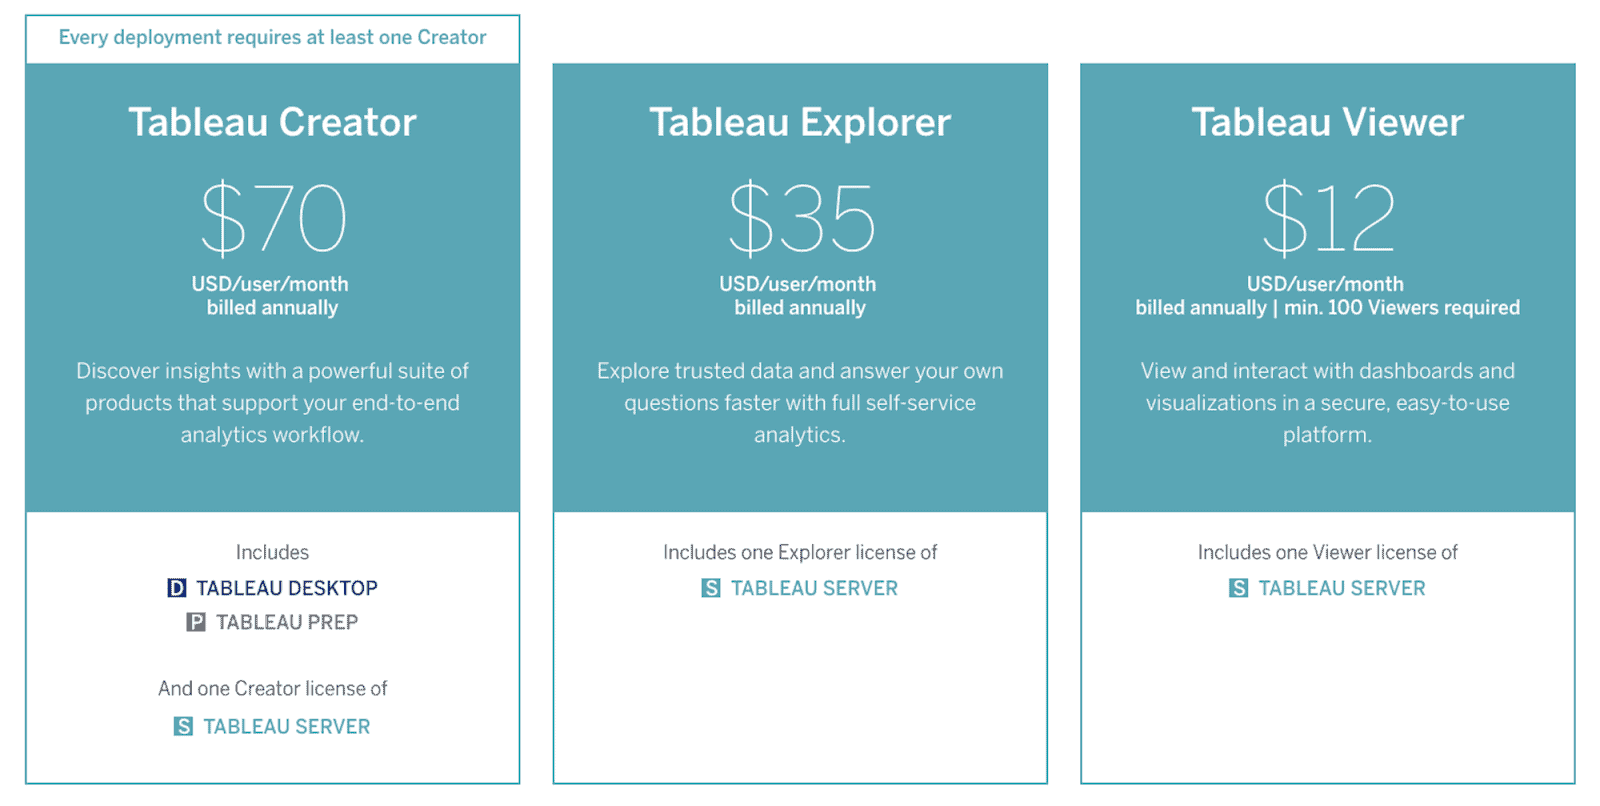
Guide for connecting Tableau with Snowflake
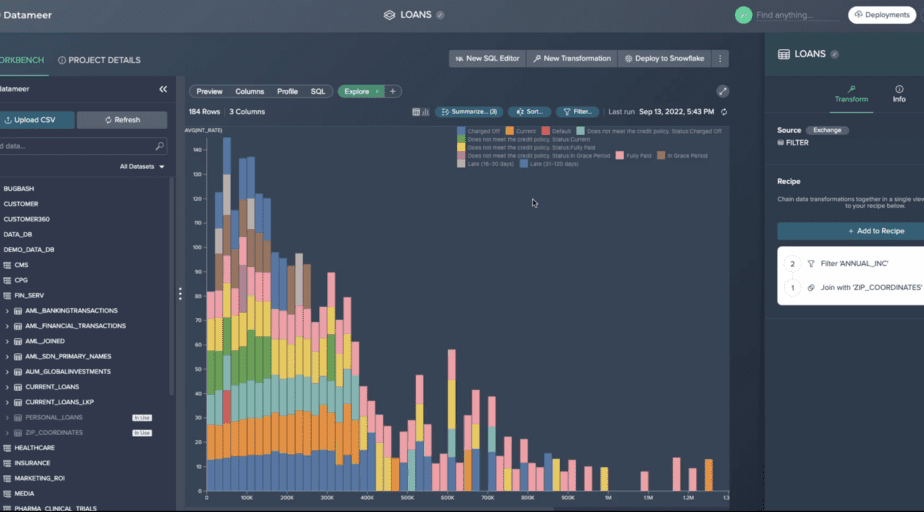
6. Datameer, Your Snowflake Aide.
We have just completed the list of our top picks for Snowflake reporting tools for Snowflake in 2022.
As with every data process, there are prerequisite steps to achieving quality reports and dashboards.
Before you plug your preferred BI tool into your Snowflake environment, you should ensure you have clean, modeled, pre-processed data.
Datameer, a SELCT Snowflake partner, and a Saas transformation tool can help with this.
With Datameer, you can analyze, visualize and prepare your data views before redeploying them into your Snowflake tables.
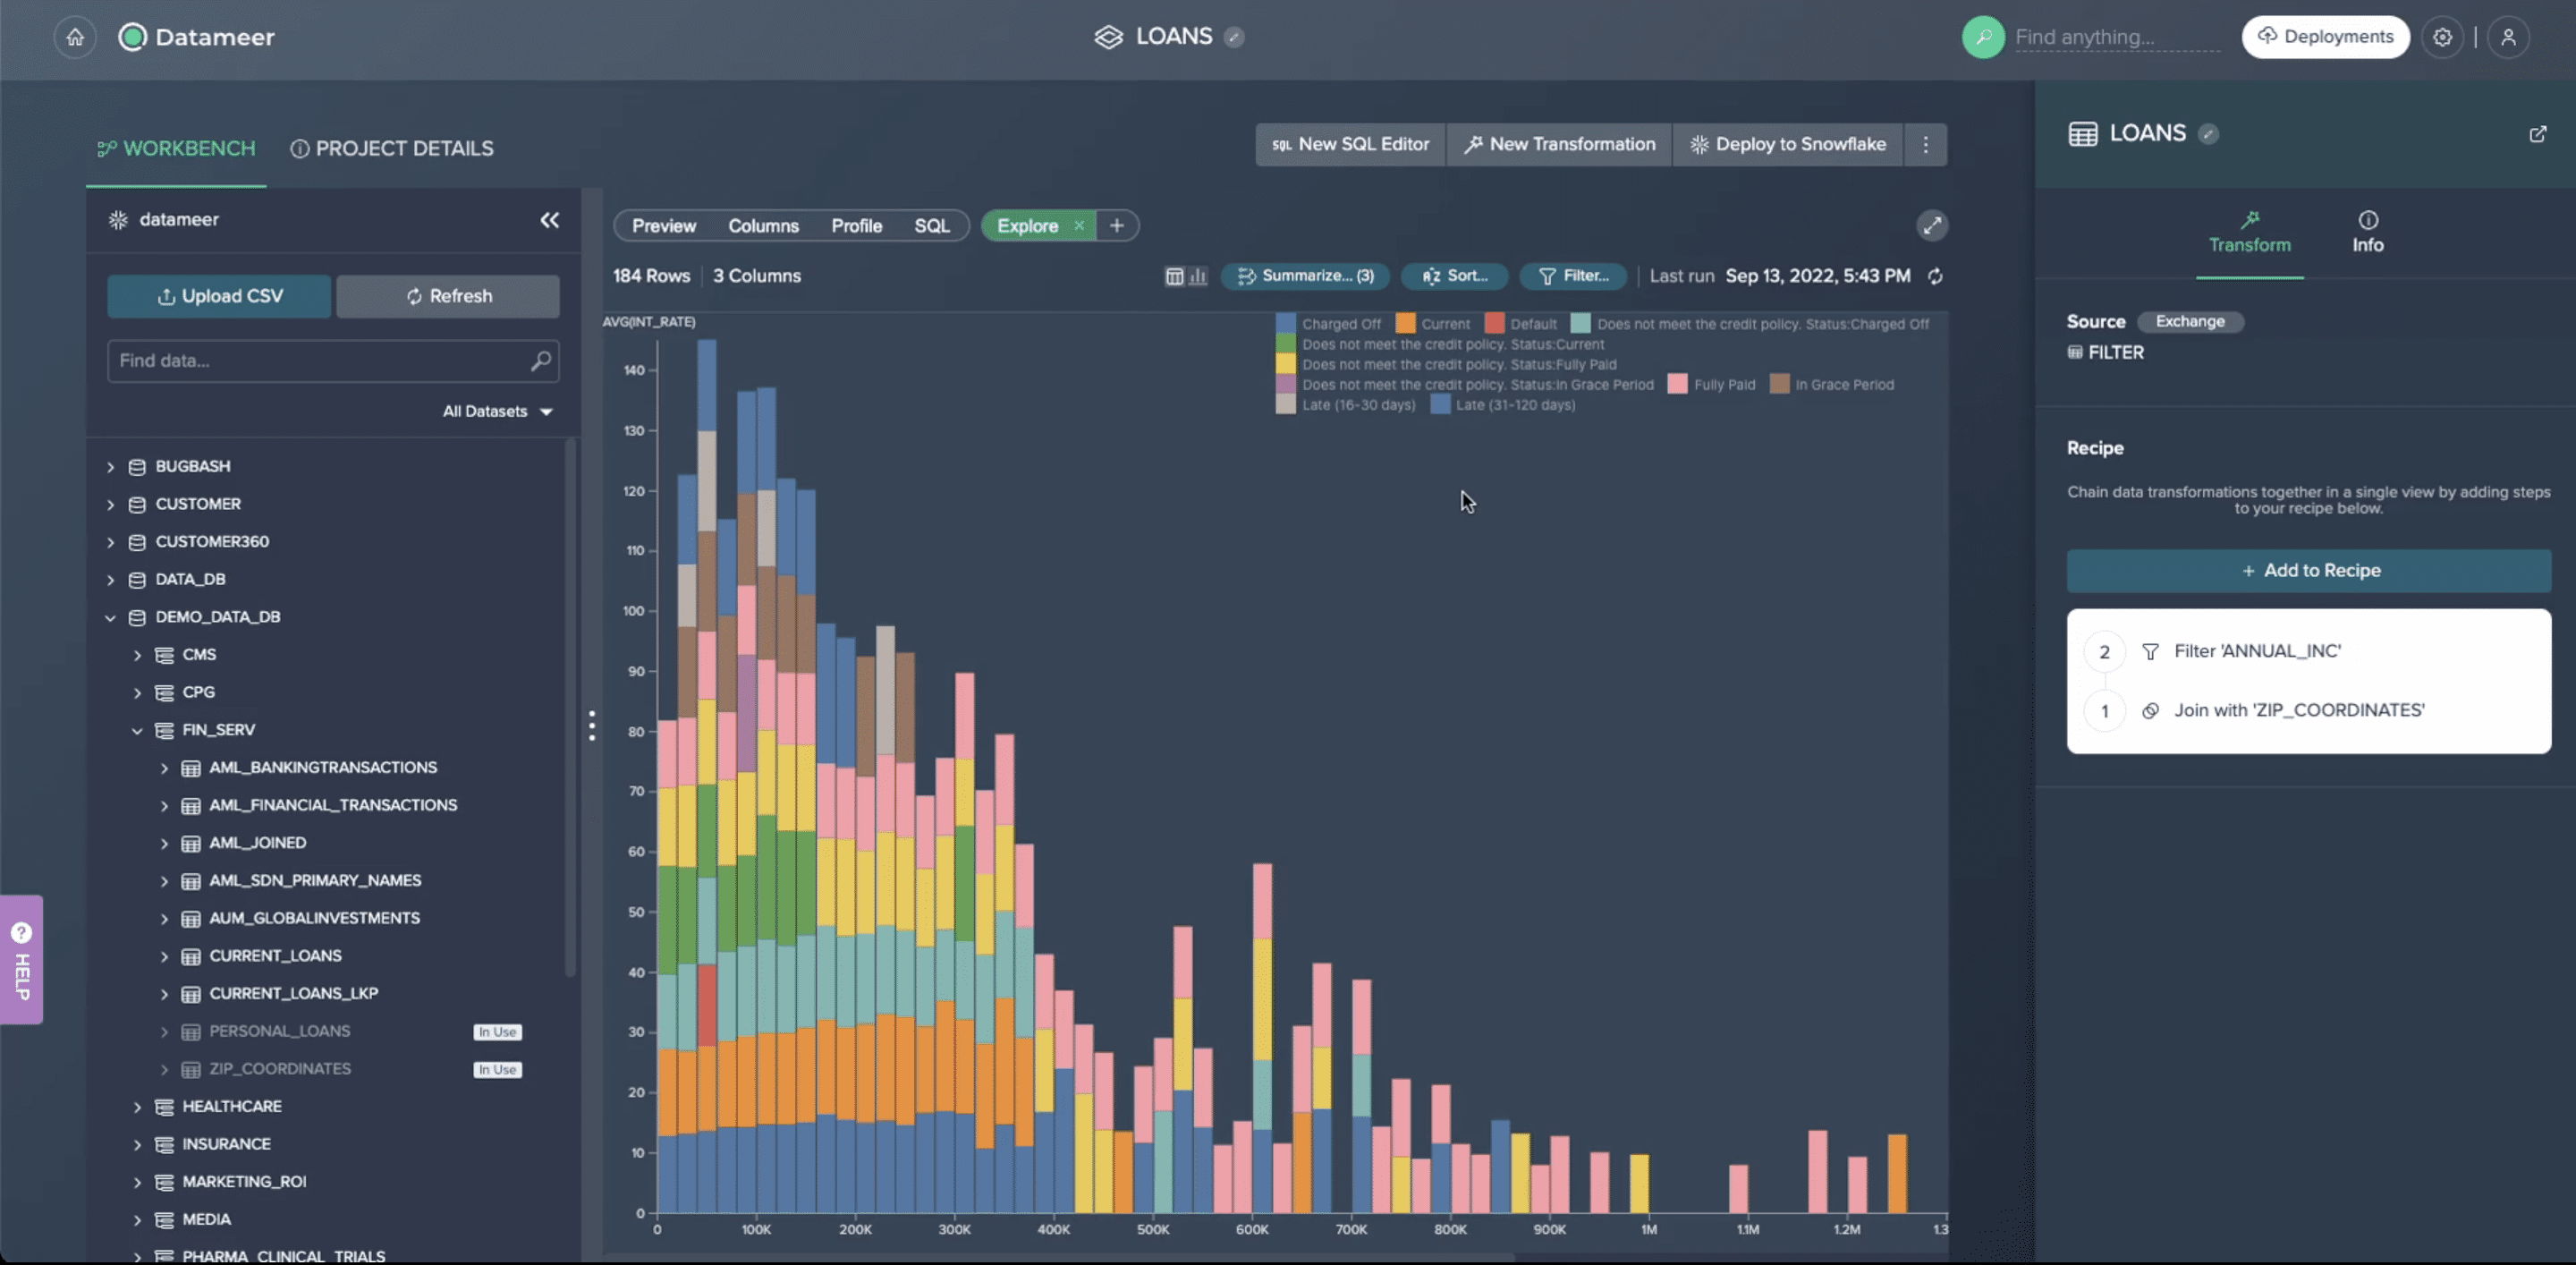
You can also Schedule and Email Reports from Snowflake with Datameer.
Need a simple solution for your ad-hoc data questions?
Need a way to create quick reports on your Snowflake data sets?
Check out Datameer’s built-in Snowflake reporting tool and collaboration capabilities today.


