Cleaning Data in Snowflake to Create Cumulative View Bar Chart in Tableau
- Tableau FAQs
- December 13, 2018

Welcome data traveler; this article is divided into two parts, 1. d ata cleaning with Datameer and 2. h ow to create the cumulative view bar chart in Tableau.
Data Cleaning with Datameer!
Data cleaning and transformation are fundamental to data visualization because clean, error-free & consistent data is much simpler to represent in charts and graphs.
This is why Datameer in Snowflake provides simple options to clean, query and transform your data before visualizing it in Tableau or any other visualization tool.
In Datameer, you can manage data columns, explore, sort, filter, extract and aggregate your data. These features leave your data squeaky clean, error-free, and in better quality for visualization.
And after transformations, download your cleaned data as a CSV file and load it into Tableau for visualization.
Take a sneak peek at the video below to explore features of Datameer that aid data cleaning:
How to create the cumulative view bar chart in Tableau?
To calculate the cumulative total, you do not need to write measures or Calculating Columns; for this, Tableau has quick measures.
- Add a measure to the graph.
- Then right-click on the measure as shown in the image.
- Select Running Total in Quick Measures
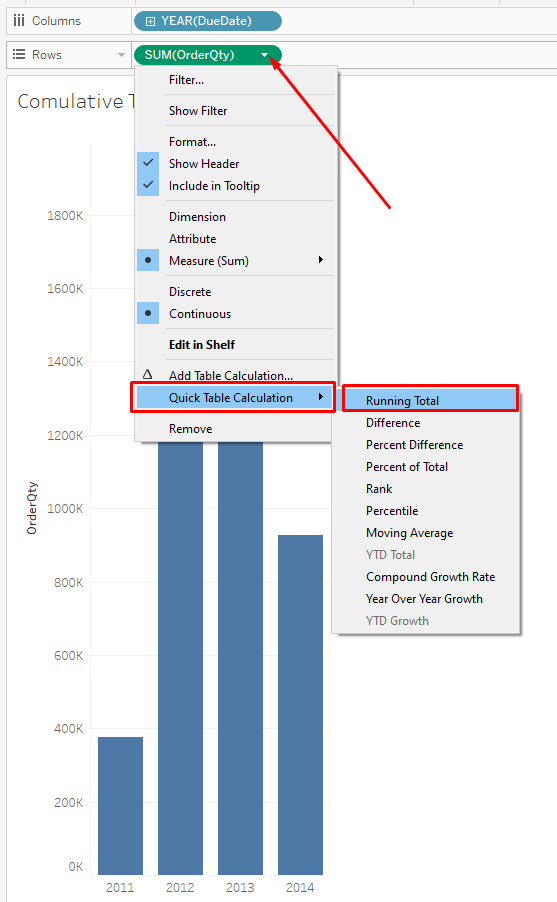
That is how to create the cumulative view bar chart in Tableau using Running Total.
Up Next: