Strengths and Weaknesses of Tableau Desktop
- Datameer, Inc.
- July 12, 2020

Tableau Desktop is one of the most common tools used by analysts. We will explore some of the advantages and limitations of Tableau Desktop. I’ll provide some options for working with large data sets and advanced calculations in Tableau Desktop more efficiently and collaboratively. Finally, we will also see how Datameer Spotlight extends Tableau Desktop’s value and all your analytics assets.
Tableau is one of the best tools when it comes to visualization and interactivity with data for analysis. Tableau performance will degrade if you have large data sets or data spread across different systems and need the ability to connect to all of your data at once. Given the need to create extracts of data in Tableau, other methods used with Tableau are better suited for optimizing complex data landscapes.
Besides, Tableau Desktop, by itself, cannot be published online for viewing. This hinders valuable collaboration for analytics teams. This collaboration is an element that is even more important with the recent need for analytics teams to work remotely.
Advantages of Tableau Desktop
Intuitive Interface
- Tableau uses a drag-and-drop interface, and it works great for newcomers. The “show me” menu allows you to build out graphs with a click of a button.
- Tableau makes items easy to find when building a viz. Users also discover many features by simply right-clicking. For example, converting dimensions to measure and vice-versa and assigning Geographic roles to dimensions is a breeze and promotes discovery with the data.
- There is no scripting or programming knowledge needed to use Tableau. This is great for non-technical analysts and business users who want to get insights. Calculated fields, which are lite coding, act similarly to Excel formulas. With a little trial-and-error, business users who write formulas in Excel pick this up quickly.
- Because of the drag-and-drop interface and the show-me menu, users build visualizations in seconds while other BI tools take much longer. To update formatting, right-click, and hit format. The items are optimized for speed since there is no scripting layer needed to update.
Interactivity With “Canned” Filters
Tableau comes with three great interactivity options that are fairly easy to set up: Filters, Actions, and Parameters.
Think of it this way: filters in Tableau are specific to a data source, parameters are not. Filters are created on the worksheet level. Tableau’s parameters can be reused across the entire workbook. Generally, filters can get the job done, but there is a compromise. While filters are easy, they can be slow, particularly when there are many dashboard data sources. Also, filters cannot be used when there are different data sources in a dashboard. Parameters must be used instead of a filter when trying to filter across different data sources.
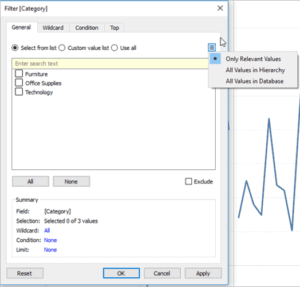
Creating a filter in Tableau:
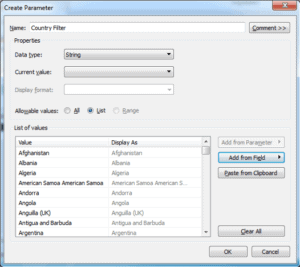
Building a parameter in Tableau:
These are similar ways of filtering data in dashboards but are used for different reasons. Each has advantages and disadvantages.
- Filters: Tableau gives users the power to filter sheets or data sources in one click. This is impossible or requires advanced setup in some other BI tools.
- Actions: Users’ actions are communicated between sheets. This makes Interactive dashboards easy to set up, with no scripting needed.
- Parameters: Parameters allow developers to build customized input boxes to select from a list, a range, or type in their own value.
Limitations of Tableau Desktop
Cannot Store Variables
Programming languages such as R and Python work in a waterfall manner and allow you to store variables at different stages in your script. Since Tableau has no scripting layer, there’s no easy way to store variables to save an overall number. Tableau does provide level-of-detail (LOD) functions to help solve this issue, but it is not intuitive and requires some guidance from a Tableau power-user to use. Other BI tools that come with a scripting layer, such as Power Query Editor in Power BI Desktop, can provide more intuitive ways to set it up.
Not for Complex Calculations or Advanced Statistics
Also, due to the lack of a scripting layer, Tableau is not optimized for building some of the most complex or advanced calculations. Users build relatively basic functions easily, but as layers are added to dashboards, they quickly run into issues, including painfully slow response times or corrupting workbooks (tip: there is no autosave in Tableau, so save often!). In a common example, referencing the same calculated field multiple times within another calculation will also result in performance issues.
If you are using Tableau but need to include complicated logic, LOD calculations can help solve some issues. A better method (for technical users) is to use a scripting layer before sending data to Tableau. Another method is to use Datameer Spotlight to perform advanced calculations before sending data to Tableau. Datameer Spotlight provides an intuitive environment where any user can perform advanced calculations on the data. Datameer Spotlight also has a scripting layer for those who know how to write some code. Besides, Datameer Spotlight is a live connection to Tableau, so the results of advance calculations appear immediately in workbooks and dashboards.
Breaks With Too Much Data
Although this has improved, Tableau is not meant for native connections to big datasets. Tableau users are familiar with blending challenges and limitations. I spent too many lunch breaks, wondering if my blend (or query) would be complete when I returned to my desk.
But also, if you have billions of rows or terabytes of data, Tableau’s data engine (named Hyper) is not meant to connect to that raw data. Custom SQL features within Tableau Desktop can make these datasets smaller through extracts before sending and blending in Tableau. But this requires not only a great deal of data movement but also data replication. Add the need for coding knowledge on top, and we see that would limit the data that can be explored and used to make the best business decisions.
As these unbridled data extracts grow, it creates not only additional storage but also computes requirements. More importantly, it means the data used in dashboards isn’t live – and it may not be current. This method requires analysts to manually refresh an extract to update data, taking time and resources away from more important work.
The Hyper Data Engine
As mentioned above, Hyper is Tableau’s in-memory data engine. The in-memory approach is great, as long as you have enough memory. But Tableau’s native in-memory approach degrades as the data increases – and it fails at 3TB. Although there are workarounds and performance tips, other BI tools are much better at connecting to big datasets. Both Looker and Amazon Quicksight are good examples. However, both of these BI tools are harder to learn, slower, and do not provide as many visualizations or interactivity options as Tableau.
Extend Tableau’s Value With Datameer
Datameer fills in one major gap in Tableau Desktop – data transformation. Learn about Datameer compares with Tableau Prep by reading our comparison guide.
Datameer SaaS Data Transformation is the industry’s first collaborative, multi-persona data transformation platform integrated into Snowflake. The multi-persona UI, with no-code, low-code, and code (SQL) tools, brings together your entire team – data engineers, analytics engineers, analysts, and data scientists – on a single platform to collaboratively transform and model data. Catalog-like data documentation and knowledge sharing facilitate trust in the data and crowd-sourced data governance. Direct integration into Snowflake keeps data secure and lowers costs by leveraging Snowflake’s scalable compute and storage.
Are you looking for a no-code or low-code data transformation solution for Tableau that your data and analytics team can use?
Learn more about our innovative SaaS data transformation solution, Sign up for your free trial today!