How Do I make a Funnel-Like Graph in Tableau With Multiple Measures?
- Tableau FAQs
- December 13, 2018

A funnel, also called a funnel, sales process, or cycle can bring significant clarity to your sales data. If you are interested in identifying customers who are dropping out of the sales process, understanding your customers’ buying path, or visualizing if you have enough leads to meet your sales goal, you can do it with a funnel.
1. Duplicate the measure you want to use to visualize the funnel (customers, revenue, visits).
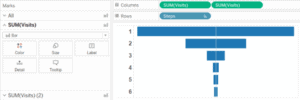
2. Put the two measures on the column shelf.
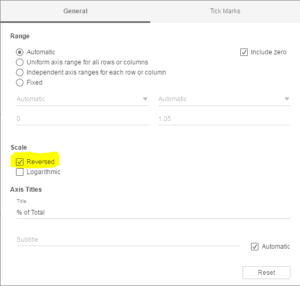
3. Reverse one of the two measure axis. You will find the option by double-clicking on the X-axis:
4. Add to the Rows shelf the dimension you want to split your funnel (the sales stages, the steps, the pages types, etc.). This is what you should end up with:
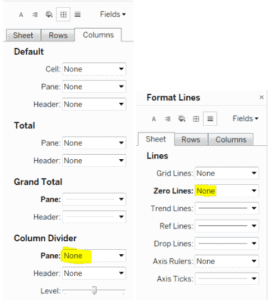
5. Don’t forget to customize your formatting to eliminate any lines—especially the column dividers and the Zero Line that would otherwise divide your funnel in two.

Up Next:
Read How do I create a division calculation via calculated fields in Tableau?