Shrinking the Analytics Cycle
- John Morrell
- May 13, 2020

Even with modern self-service analytics tools, it still takes on average a week to produce new analytics results, driving many organizations to discover ways of shrinking the analytics cycle. With much of the waste in the analytics workflow centering around data activities – discovering, accessing, and exploring data assets – streamlining these aspects can dramatically shrink the analytics cycle by 90% or more down to a few hours. Doing so delivers tangible and measurable ROI to the organization. Let’s explore how.
Overall Challenges
In today’s digital economy, the business pace has dramatically accelerated, drastically reducing business leaders’ time to make data-driven decisions. New business questions arise daily, creating a backlog of analytics requests. The challenges analytics leaders face with the current analytic cycles are:
- Length– When the business needs new analytic results, they need fast answers to adjust to business conditions. Taking many days to deliver results is too long, rendering insights obsolete.
- Output– Today’s business situations often require intricate answers to take particular actions. The analytics delivered to the business need highly detailed results to make data-driven decisions.
- Trust– Business teams need to trust that analytic results are accurate to rely on them for making data-driven decisions. If the business does not trust the results, the cycle may need to be repeated, or worse, the business will revert to gut-feel decisions.
Phases of the Analytics Cycle
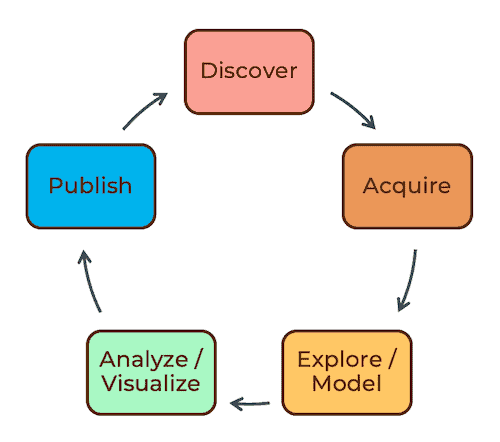
The accompanying graphic lays out the major phases of an analytics cycle. The five major phases are:
- Discover– In this initial stage, the analyst will clarify and quantify the question, then find relevant information – data, previous work, knowledge – that can help provide answers.
- Acquire– Once assets are identified, the analysts gather the data assets necessary for the analysis.
- Explore & Model– From there, the analyst will explore the various data assets to determine fit and then model (combine & shape) the final assets to be used.
- Analyze– Once data is in final form, the analyst can analyze and visualize the data to find the critical insights and results from the business needs.
- Publish– Finally, the analyst will publish the final dataset, analytics results, and visualizations for the business teams to consume.
Where is Time Spent?
The emergence of self-service analytic and data science tools has enabled data analysts, business analysts, and data scientists to shorten their analytic cycles and reduce the time to deliver new insights. Yet, even with the advances in tools, it still takes close to 5 business days to produce new results when the business asks new analytic questions, according to one leading self-service BI tool vendor.
Much of the time spent in analytic cycles revolve around data-related activities. According to an IDC study, analysts spend 87.7% of their time on data-related activities and only 12.3% of their time on analysis. Another IDC study showed that analysts waste 44% of their time every week because they are unsuccessful in different activities. The leading time-wasting task is searching for data (51% of respondents).
Using this information and other data from interviews with our customers, we estimate that the time spends on an analytic cycle looks like the table below – assuming the 5 days to answer a new analytic question per the BI vendor report.
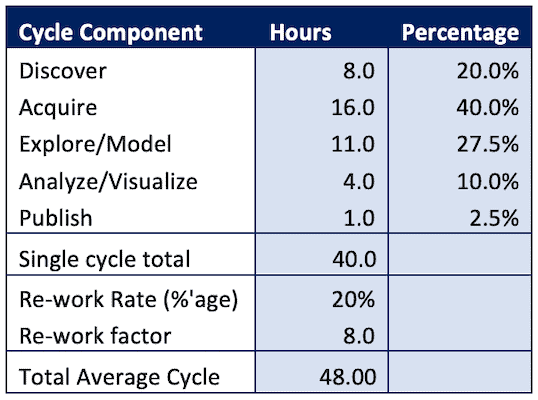
We added a factor here: what happens when the results were not what the business required, and the analysis needs to be performed again. We call this the “re-work” factor and found that up to 1 in 5 analyses needed to be performed again, lengthening the true average analytics cycle to 6 business days.
The Datameer Spotlight Effect
The Datameer Spotlight virtual analytics data management platform helps analytic teams be more productive in their data-related tasks. Datameer Spotlight speeds the discovery, exploration, acquisition, and modeling of data and analytics assets. It also facilitates collaboration and knowledge sharing to build trust in analytic assets and enables the easy reuse of assets across the analytics team.
The biggest impact Datameer Spotlight provides to the analytic cycle is in the discovery, acquisition, and exploration/modeling phases:
- Discovery– Rather than asking IT teams and colleagues about various datasets via sneaker-net, Datameer Spotlight’s search, collaboration, and knowledge sharing features make it dramatically faster to find and use the right data the very first time for the analytic problem at hand.
- Acquisition– Instead of waiting for IT to provision data, Datameer Spotlight connects virtually and securely to various data sources regardless of location providing analyst self-service access to data assets across the organization.
- Exploration/Modeling– Point-and-click modeling tools let analysts shape datasets to their needs without writing any code and explore the data using their favorite data discovery tools to find and create the right fit for the problem.
Datameer Spotlight can also shorten the analyze/visualize phase of the cycle due to the increased trust analysts have in the data. Greater trust in the data allows less experimentation in the analyze/visualize phase. The analyst has more confidently honed in on the data that works most effectively for the problem at hand. Trust and knowledge also impact the average analytic cycle by eliminating re-work due to errors or poor data interpretation.
In Table 2, you can see an example of the impact Datameer Spotlight has on the analytic cycle, with three of the data activity phases being reduced over 90%, the analysis phase being reduced, and re-work being eliminated. The average analytics cycle is lowered by 91.7% down to 4 hours.

Wrap-Up
As you can see, Datameer Spotlight can potentially reduce analytics cycles by over 90% and deliver new insights within hours. The business team asks a question in the morning, has resulted in the afternoon, and can formulate and execute new action plans by the end of the day. The value to the business results in:
- Measurable productivity increases and value from the analytics organization
- Faster time to action eliminates costs from executing ineffective processes while waiting for answers
- Through increased productivity, the analytics team delivers more answers delivering an even greater impact on revenue and business processes
- Greater trust in the analytics produced eliminates guesswork and gutfeel decisions, producing a further positive impact on the business
Interested in calculating the value and ROI Datameer Spotlight can bring to your organization? Please read our complete white paper Measuring the ROI of Datameer Spotlight. Or take a test drive Datameer, Sign up for your free trial today!


