Product Analytics: Your Ultimate Guide to a Perfect Product
- Jeffrey Agadumo
- July 18, 2022
In this article, we will look at the definition of product analytics, its benefits, and some metrics to measure. And if you stick around till the end, a live example of transforming data for product analysis using Datameer .
A Guide to the Perfect Product with Product Analytics
Creating the perfect product is like cooking the perfect meal. Imagine you’re a professional chef with excellent cooking skills, and don’t get me started on that new shiny burner you just purchased; a real game-changer in the “industry.”
But even professional chefs cook lousy food sometimes. Occasionally, a slight variation in the combination of those herbs and spices and your ‘perfect’ dish becomes a hot mess. You could potentially have a great dish, and people still wouldn’t like it, especially if the product is new.
And, of course, there are allergies. If you had just one customer with allergies, you are probably one ingredient away from having them spend the night at the ER and risk having terrible reviews that drive away even your loyal customers.
The perfect meal is a meal your customers accept and are happy to eat. Similarly, the perfect product is a product that is built with the customers/users in mind.
There’s a lot to measure and track when offering products to customers. You’d want to know how different customer segments interact with your product, what is working and what is not, and how updates affect customer engagement.
Figuring it out can be overwhelming, but product analytics lightens the load and clarifies the journey.
What is Product Analytics?
Product analytics is the process of tracking, analyzing, and visualizing customer behavior using data derived from their engagement with your product or service.
In truth, a perfect product is always in the “kitchen,” you have to keep a steady data analysis streak and continuously tweak and innovate to improve your product according to user specifications.
Product analytics aims to create valuable products optimized to meet your customer’s needs, improve your user experience and impact your business metrics positively. Product Analytics is where data analysis meets product optimization.
But with robust product analytics tools like Datameer on Snowflake, you can collect customer engagement data with precision and objectively transform and create perfect datasets for product funnel analysis.
Why is Product Analytics Important?
Keeping a close eye on your product analytics dashboard should lead to the following:
- Product analytics is an objective source of truth; answers to questions that impact your business can be gathered quickly and reliably.
- Product teams connect with users personally by using engagement data to improve product design and determine the features to roll out, optimize or phase out.
- With product analytics, you can better interpret quantitative metrics, clearly point to the cause of churn , determine product value, capitalize on customer affinity points to drive profitability, and make informed decisions.
- With a 166% increase in revenue attributed to businesses with improved personalization, businesses with the best customer buying journeys listen to the product data; they create customer-centric experiences that leave them feeling like the product was created just for them.
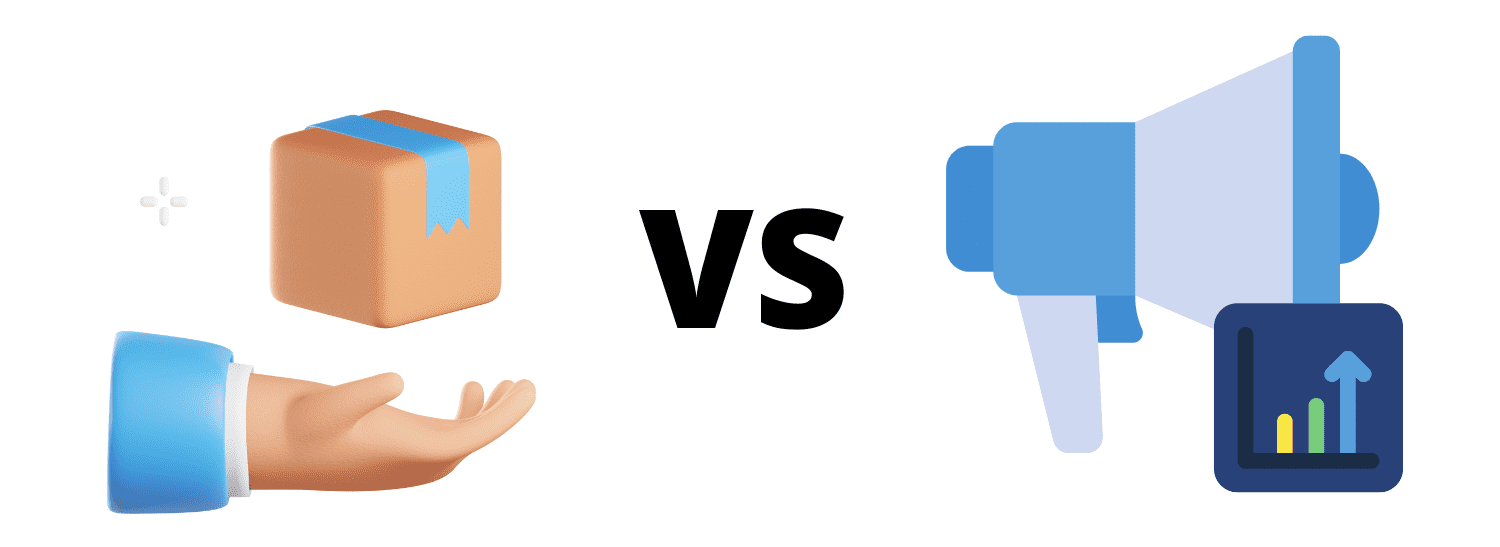
Differentiating Product Analytics and Marketing Analytics
The similarity between marketing analytics and product analytics is that they both employ similar data analysis strategies and tools to generate critical metrics. Other than this, they are pretty different.
Marketing analytics is focused on generating insights from marketing campaigns. It involves compiling and analyzing data from different marketing channels to generate metrics that indicate the success of a campaign, areas of improvement, impact on customer acquisition, and ROI.
Product analytics focuses on your product and your customer experience and provides insight on how to improve them. It seeks to answer the questions such as:
- Do customers enjoy using your product?
- Are they staying with your product long-term?
- How do you segment your best customers to improve their user experience?
Marketing analytics is high-level and focuses on analytics for marketing channels, whereas product analytics is streamlined to users. The goal of marketing analytics is to improve ROI, while the goal of product analytics is to improve the customer experience.
Key Terminologies
Engagement
Engagement refers to the relationship cultivated between a brand and its customers, usually intending to make a sale.
Stickiness
What’s your favorite app? And what features make it your favorite?
Instagram? DoorDash perhaps? Or maybe the Snowflake Events app; you’d want to keep that one handy to stay in touch with our events.
There is a term that describes the pile of empty boxes from Zara in customers’ basements, and it’s not an obsession.
It’s “ Stickiness .” Stickiness is the tendency of a customer to make continuous repeat purchases of your product.
Retention
Stickiness should not be confused with customer retention; retention measures an organization’s ability to turn first-time engagers to repeat buyers and keep them over a period, while stickiness measures organic interaction between customers and a product that keeps the customer returning.
An increase in engagement leads to an increase in stickiness , leading to customer retention and, naturally, revenue.

What metrics can you measure with Product Analytics?
Product analytics is all about tracking and using data and analytics to narrate how users interact with your product.
Generally speaking, we track:
- Users: any user who interacts with your product.
- Events: including interactions with your product, e.g., clicks, swipes, and product page views.
- Properties: Gain more background of the users and events they engaged in, like product category viewed, user acquisition channel, or gift vouchers applied to understand how customers respond to vouchers.
Some typical analyses you can perform on a robust product analytics tool include:
Funnel Analysis
Funnel analysis is the highlight of product analysis. It reports on a business or website’s steps to get customers to carry out a particular activity.
Your user funnel will determine what kind of event you want to track, and the nature of each event will determine what details you want to know about the event.
Eg an eCommerce funnel may look like this: Visit website => search for product => filter your search => add item to cart=> payment
- It shows the user and events property at every stage of the funnel.
- It forms the basis for almost every other type of metric you can calculate for a product.
User Flows
User flows report a user’s journey leading up to an event or journey after an event, e.g., how users navigate an eCommerce site or what button users click after they land on your page.
- It offers an alternative to monitoring users’ behavior other than funnels.
- It can help you build and optimize personalized funnels around key activities that users carry out to reach your end goal.
Retention Analysis
Retention analysis reports the time between when a user performs one activity and when they perform another.
- It helps you compare the retention rate of different customer segments, e.g., which segments engaged your product the longest?
- It helps you can track product improvement over time, e.g., which
- You can track customer churn and the specific part of your customer’s lifecycle where churn occurs.
A/B or Multivariate Testing
The Test allows you to split your customer base into two or more groups, where you can offer each group a different version of a product to determine which version your users prefer.
- Data generated from the tests help you determine which products appeal to your user base the most.
- It also provides crucial data on why users are not engaging other products/product versions.
Cohort Analysis
Similar to A/B testing, you track user engagement by category in a cohort analysis. Users of your product with similar traits are grouped and analyzed to improve your product offering.
- It helps to determine when and how best to re-engage your users.
Churn Analysis
Churn Analysis reports on the rate at which customers abandon your product.
- Monitoring customer attrition rate allows you to get feedback to improve your product offering.
- Improve retention by identifying and improving points where customers churn in the buying journey.
Watch: Snowflake Native Data Transformation for Analytics
No more guesses, no more round table conferences to determine which product feature feels best, listen to your data, and watch your product sing the song in the hearts of your customers.
Of course, as promised, watch the On-demand Example of Product Analytics
In this webinar on Snowflake Native Data Transformation for Analytics where we walk you through a representative product analytics example in depth. We will use Datameer to transform data and create live product analytics datasets.