How to use Marketing performance data to create revenue projection reports
- Datameer, Inc.
- July 19, 2022
This article will cover marketing performance data to create revenue projection reports. We will look at marketing performance data, some examples of marketing performance metrics, and projection methods you can use to create revenue projections.
Marketers cannot overlook the significance of data. If you work in marketing or operate a business, it’s essential to understand the power of a revenue-driven strategy.
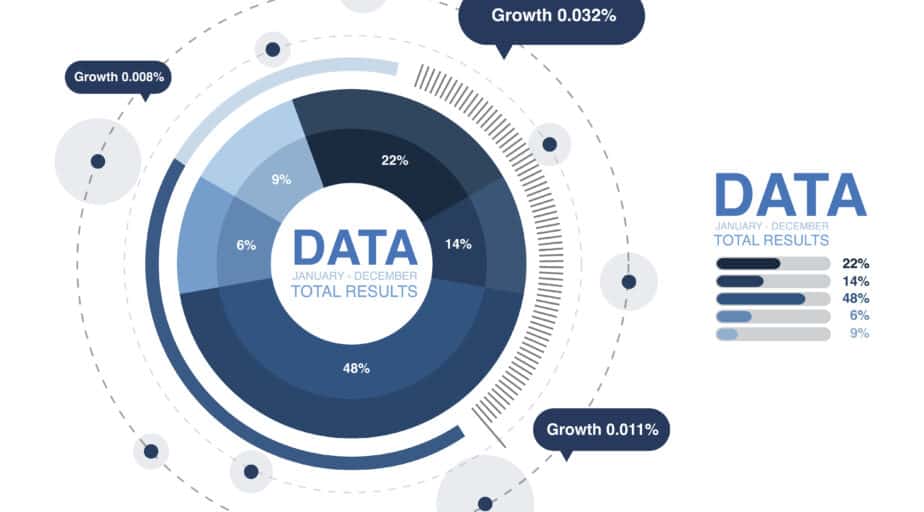
What Is Marketing Performance Data?
Marketing performance data is a compilation of crucial performance marketing data used to track a marketing campaign’s efficiency. The metrics and results of marketing performance data are used to assess the success of your marketing initiatives and revenue objectives.

Once you understand how to measure and manage your marketing performance type data, you can develop revenue projection reports to assist you in predicting sales and revenue.
With marketing performance out of the way, let’s discuss revenue projection; what about it?
Revenue Projection Report – What is It?
A revenue projection report uses historical and present marketing performance data to predict future revenue.
Businesses use this report to forecast sales and understand how their marketing efforts affect their bottom line.
4 Key Marketing Performance Metrics For Revenue Projection
To create a revenue projection report, you will need precise data on your previous marketing activities , knowledge of the nature of the sales cycle within your business, and the ability to speculate how your marketing activities will impact future sales.
Let’s focus on the first step, precise data on marketing activities…
Here are a few “marketing activity” metrics that highlight marketing performance:
Sales data
This is the total revenue your business has generated from all sales channels over a specific time.
CPA (cost per acquisition/conversion)
This marketing metric calculates the cost of acquiring one paying customer through a particular campaign or channel.
To determine CPA, you can divide the cost of a marketing channel or campaign by the number of clients acquired.
Customer lifetime value (CLTV)
Customer lifetime value (CLV) is the sum of a customer’s value to a company throughout their relationship.
This figure is determined by how much an average customer spends with you each time they purchase, how frequently they do so, and how long they remain a customer.
The true ROI of your marketing efforts can be calculated once you are aware of your average CLTV.
Marketing return on investment (MROI)
The process of attributing profit and revenue growth to the effects of marketing initiatives is known as marketing ROI.
We can obtain this by dividing the amount spent on marketing (globally and through specific channels) by the amount of income produced.
Projections methods Used By Marketers Today.

Now that you understand the basics of using marketing performance data to create revenue projection reports, it’s time to learn what methods you can use to achieve your revenue projections.
What is a Projection Method?
Business leaders utilize projection methods, formulas, or procedures, to foresee sales, revenue, leads, and other essential operations.
Annual projections can be made based on the data generated by the projection method.
Conversely, without the proper projection approach, your projections may be random and lead to ill-informed decision-making.
All projections methods are not necessarily used for revenue projections, but their insights can help inform your Revenue Projection.
Types of Revenue Projection Methods
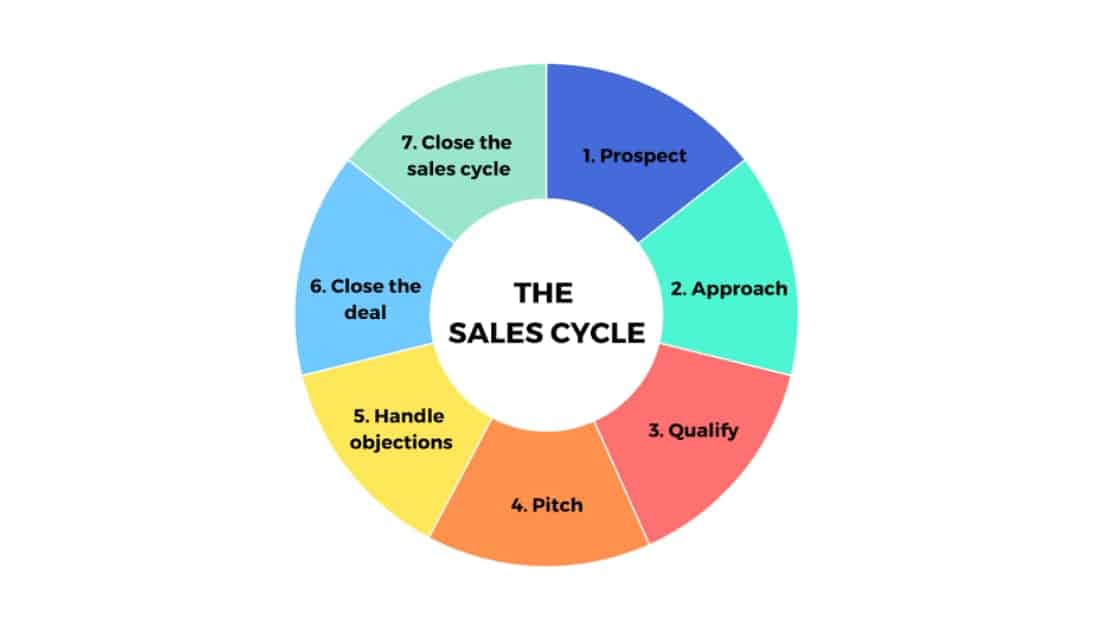
1.Length of Sales Cycle.
The cycle length can be referred to as the time it takes for a prospect to pass through every stage in the sales cycle, from prospect to repeat buyer.
Understanding the length of your sales cycle and factoring that into your revenue projection will help you create a marketing and sales funnel focused on closing deals rather than rushing prospects.
2.Time Series projection Model.
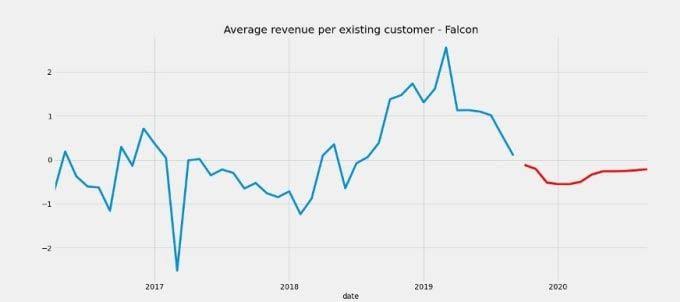
If you haven’t guessed it by now, the essence of many of these projection techniques is the use of historical data to predict future outcomes.
With a time series chart, we can do precisely that.
We can present a series of data points collected over a specified reporting period. The x-axis plots time, and the y-axis plots data points such as your sales.
You can use this method to predict when future sales might happen based on when sales happened in the past.
3.Regression projection model.
Regression analysis indicates the nature of the relationship between variables.
Utilizing historical data and performing a regression for key marketing actions is essential to conducting a successful regression projection approach.
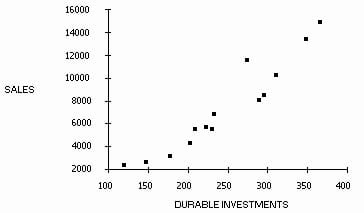
With a solid regression model set up, you will be able to see a correlation (or lack thereof) between, let’s say, a specific activity like “emails sent” and your number of closed-won deals over time.
For a successful regression approach, tons of observations are required, i.e., you’ll need about 10-15 observations of past marketing campaigns, website traffic, and customer purchase history to make credible projections.
Benefits of Using Marketing Performance Data to Create Revenue Projection Reports
Using marketing performance data to generate revenue projection reports come with a handful of benefits, such as:
1. Obtaining an accurate picture of the effectiveness of your marketing initiatives : You can use the insights from these reports to modify your campaigns to help you get the desired outcomes.
2. Assessing the profitability of your marketing initiatives: You can manage your marketing budget more effectively in the future if you know how much money each campaign is producing.
3. Future expansion can be planned for: You can improve business judgment concerning resource allocation by estimating future revenue based on historical performance.
Datameer: A Tool For Modeling Marketing Performance Data
We’ve discussed methods, metrics, and models but not the tools.
Typically, In large marketing organizations with massive amounts of data, our marketing performance data would most likely be consolidated in databases or a data warehouse such as Snowflake.
In such cases, we can utilize tools like Datameer (in Snowflake) to perform these complex data calculations and modeling activities on our marketing performance data.
Request a free trial today to experience Datameer in action and learn more about how it can transform your organization’s approach to data.
Click here to get started!


