How to pivot data in Snowflake with Datameer
- Datameer, Inc.
- February 1, 2022
I’ve noticed that some things can be a bit challenging when it comes to SQL, especially in Snowflake. For instance, pivot tables, a feature we are very comfortable doing in BI tools such as PowerBI, Tableau, or even OBIEE can be tedious when using standard SQL.
Datameer’s SaaS tool comes with a simple to use drag-and-drop feature we can use to pivot data in Snowflake. In the following example, we are going to see how easy it is done with SQL as well as with Datameer’s SaaS tool.
Let’s create a simple dataset as below:
USE DATABASE TEST;
USE SCHEMA PUBLIC;

CREATE OR REPLACE TABLE Monthly_Sales(empid NUMBER, amount NUMBER, month STRING)
    AS SELECT * FROM VALUES
    (1, 10000, 'JAN'),
    (1, 400, 'JAN'),
    (2, 4500, 'JAN'),
    (2, 35000, 'JAN'),
    (1, 5000, 'FEB'),
    (1, 3000, 'FEB'),
    (2, 200, 'FEB'),
    (2, 90500, 'FEB'),
    (1, 6000, 'MAR'),
    (1, 5000, 'MAR'),
    (2, 2500, 'MAR'),
    (2, 9500, 'MAR'),
    (1, 8000, 'APR'),
    (1, 10000, 'APR'),
    (2, 800, 'APR'),
    (2, 4500, 'APR');
Please note, the above example has been taken from Snowflake documentation here .
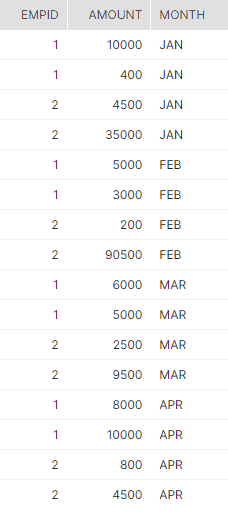
The above image is what the dataset looks like.
SELECT *
FROM Monthly_Sales
PIVOT(SUM(amount) FOR month IN ('JAN', 'FEB', 'MAR')) as pivot_values
ORDER BY empid;
The above code is used to pivot the values such that we get a sum of the amounts arranged neatly in three columns representing the first three months.
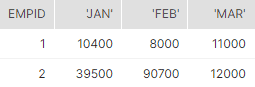
Let’s view the output as in the image above.
Let’s see how Datameer’s SaaS tool helps us to make it much easier to pivot Snowflake data, than writing a potentially complex SQL code.
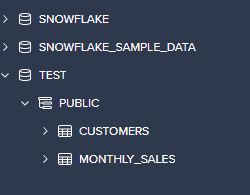
Open up a new project as above and load the Monthly_Sales table within it.
![]()
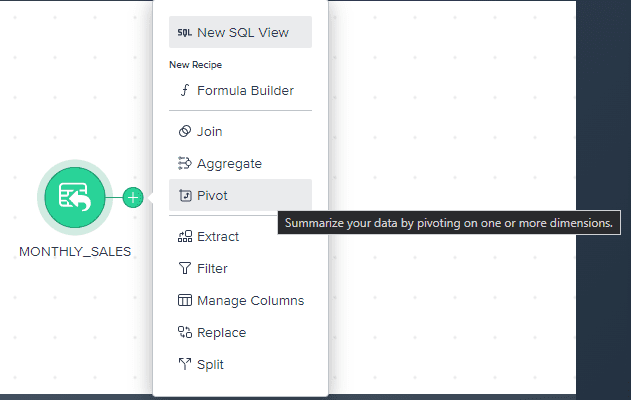
Add a new transformation to this table, as guided.
Select the pivot option to “Summarize your data by pivoting on one or more dimensions.”
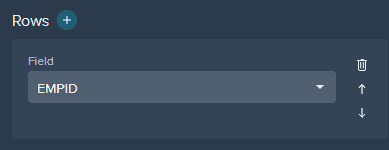
Under Rows, select the fields you want to display outside of the pivot.
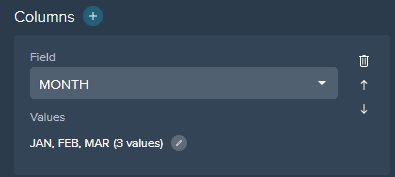
Under Columns, select the final pivoted values, in our case it is Jan, Feb, and March months.
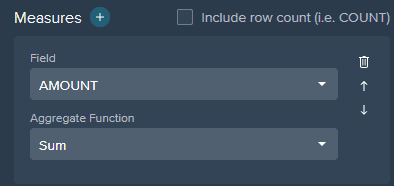
Under Measures, select the values you want populated within the “Pivoted Columns” and finally select the Aggregate function you want applied over it. So in our case, this becomes Sum(Amount).

With this, we have our required output. Click apply to proceed. Rename this recipe/step to “Pivoted_Monthly_Sales”.
As you can imagine, when the complexity increases and you have to pivot against multiple dimensions and/or measures, using Datameer’s SaaS tool is a far better/simpler option as compared to standard ANSI SQL.
This completes our simple introductory post on how to pivot data in Snowflake with Datameer SaaS. Sign up for your free trial today!


