How to Make Snowflake Query History Immortal
- How-Tos FAQs
- November 21, 2022
TL;DR: We don’t have sufficient privileges to access the SNOWFLAKE.ACCOUNT_USAGE.QUERY_HISTORY view. We couldn’t understand the variations in load on the warehouses in Snowflake of our department. The built-in Snowflake Query History table functions in the INFORMATION_SCHEMA are too limited for our purpose. We implemented a more extensive query history for all queries our role has access to overcome Snowflake’s limitations. With our expanded query history, we can understand the current usage of the warehouses of our department and how the usage has evolved.
Authors: Martin Nettling <martin.nettling@datameer.com>, André Rouél <arouel@datameer.com>, Hendrik Treutler <hendrik.treutler@datameer.com>
Problem
Typically, a Snowflake account is organized in business units with dedicated databases, warehouses, and user roles. For privacy and security reasons, the dedicated roles are isolated and can not access each other’s data. This implies access to the SNOWFLAKE.ACCOUNT_USAGE.QUERY_HISTORY view is restricted. At Datameer, we are following this pattern.
Looking at the statistics of our department’s Snowflake warehouses for the last quarter, we observed that the load varies unexpectedly. We couldn’t easily explain where some anomalous peaks of high load were coming from. We tried investigating the cause of these peaks using the built-in Snowflake query history in the INFORMATION_SCHEMA. If you are facing similar issues, look at the solution below.
We started a Snowflake worksheet and utilized the built-in table function QUERY_HISTORY_BY_WAREHOUSE. Unfortunately, this function is limited to the last seven days, so the following message, “Cannot retrieve data from more than 7 days ago“, was all we could get. Additionally, requesting more than 10,000 records at a time is impossible.
The WAREHOUSE_LOAD_HISTORY function was also not helpful. It only confirmed the observed peaks by showing some statistics about queries in status QUEUED. No other information was provided. No query-level details to drill into the root causes. The mystery behind our peaks remained worrisome.
How can we make the query history for our department persistent and easily accessible, covering multiple weeks, months, or even years without using the SNOWFLAKE.ACCOUNT_USAGE.QUERY_HISTORY view? Because we were curious and to not bother our account admin, we tried circumventing the built-in feature.
Our initial idea was to fill an IMMORTAL_QUERY_HISTORY table for our department with data from the built-in QUERY_HISTORY function over a longer period. Since the native query history function provides access to the last 7 days, the process must be automated to maintain a complete history.
Results and Conclusion
The IMMORTAL_QUERY_HISTORY table enables us to overcome the limitations of the built-in Snowflake table function. The data is easily accessible for the entire department, and our analysis queries perform better than the table function. We can now perform fast explorations and drill into anomalies without bothering our account admin.
Let’s start with a query by asking a simple question: How many queries per hour do we execute in our account?
SELECT
TIME_SLICE(END_TIME::TIMESTAMP_NTZ, 1, 'HOUR') AS "SLICE",
COUNT(*) AS "NUMBER_OF_QUERIES"
FROM "IMMORTAL_QUERY_HISTORY"
GROUP BY SLICE;
Snowsight visualization of the number of queries per hour
Thanks to Snowsight, the results are easily visualized. The results show the weekends of the last eight weeks as valleys and the core time of work days as peaks. Depending on the day, we execute a maximum of 30k to more than 100k queries per hour. The warehouse load in terms of the number of queries keeps roughly the same, and we don’t see an unusual peak like before, which is good.
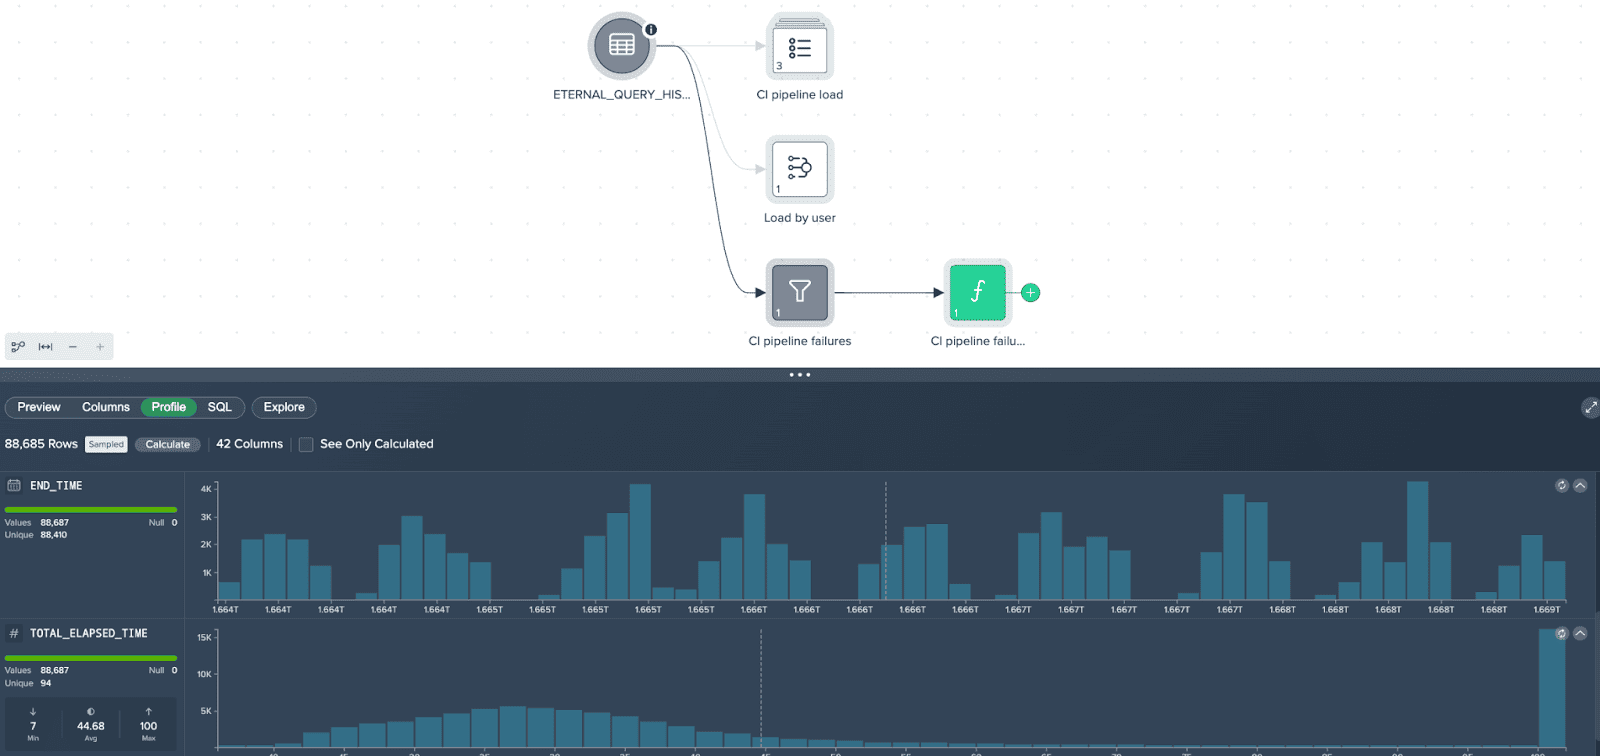
Datameer project for drilling into the query history
After this test on the Snowflake side, we added the IMMORTAL_QUERY_HISTORY to a Datameer project. The No-Code / Low-Code transformation capabilities of Datameer are useful for adjusting the query history records to our needs. We then developed several basic transformations reflecting different facets of the query history. Next, we configured Datameer to send us a report every Monday, so we can react quickly to the developments in our company. With that reporting automated, we focused our efforts on more sophisticated analysis pipelines optimizing our warehouses’ availability and costs, which we will describe in future blog posts.
Solution
If you want to do such kind of analysis of your Query History and don’t have access to SNOWFLAKE.ACCOUNT_USAGE.QUERY_HISTORY view, then apply the following recipe:
1. Create the table IMMORTAL_QUERY_HISTORY for storing the records of Snowflake’s QUERY_HISTORY table function. For simplicity, take the schema from the QUERY_HISTORY function.
USE SCHEMA "YOUR_DB"."YOUR_SCHEMA";
CREATE TABLE IF NOT EXISTS IMMORTAL_QUERY_HISTORY AS (
  SELECT *
  FROM TABLE(INFORMATION_SCHEMA.QUERY_HISTORY(RESULT_LIMIT => 1))
  WHERE 0=1
);
2. Create a task that frequently copies new entries from Snowflake’s QUERY_HISTORY function to the IMMORTAL_QUERY_HISTORY table. Make sure to avoid duplicates. Be aware of using a role with sufficient privileges, the right warehouse, and an appropriate schedule*.
* You may want to adjust the SCHEDULE of the task, which is set to one hour here. Depending on the query throughput in your account, it might be sufficient to execute the task, e.g., once per day. This decreases the traffic in the warehouse, which executes the task, and can help to let the warehouse suspend to save costs. Also, this task can be dedicated to tracking the query activity of a specific warehouse or user, and execution once per week can be sufficient.
CREATE OR REPLACE TASK IMMORTAL_QUERY_HISTORY_TASK
WAREHOUSE='TRACK_HISTORY_WH'
SCHEDULE='60 minute'
AS
INSERT INTO IMMORTAL_QUERY_HISTORY
SELECT *
FROM TABLE(INFORMATION_SCHEMA.QUERY_HISTORY(RESULT_LIMIT => 10000))
WHERE QUERY_ID NOT IN (SELECT QUERY_ID FROM IMMORTAL_QUERY_HISTORY);
Contact us to get a more sophisticated version of this task
3. Test the task. Execute the task manually, check the task results and look into your IMMORTAL_QUERY_HISTORY table to see if there are records.
EXECUTE TASK IMMORTAL_QUERY_HISTORY_TASK;SELECT *
FROM TABLE(INFORMATION_SCHEMA.TASK_HISTORY(TASK_NAME => 'IMMORTAL_QUERY_HISTORY_TASK'));
SELECT * FROM IMMORTAL_QUERY_HISTORY;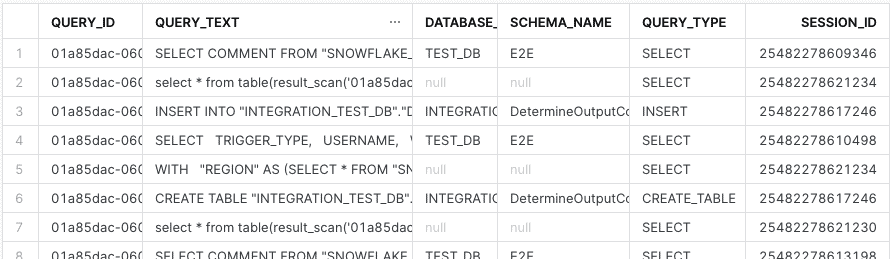
4. If everything looks good, enable the scheduling and let the task do its job.
ALTER TASK IMMORTAL_QUERY_HISTORY_TASK RESUME;If you have more than 10,000 queries per hour and/or want to save compute costs, you can use the SNOWFLAKE.ACCOUNT_USAGE.QUERY_HISTORY view or you need a more sophisticated version of the above-described Snowflake task to permanently track the query history entries. Just contact us, and we will provide you with the code!
Outlook
Using the IMMORTAL_QUERY_HISTORY table, we can not only tackle the initial problem of understanding outstanding peaks of much higher loads but can also be used to answer other questions around warehouse statistics and optimize warehouse usage, hence reducing costs.
We will infer the tables and views accessed by the related query by interpreting the QUERY_TEXT field of each row in the IMMORTAL_QUERY_HISTORY table. Questions that we want to answer with this additional information include the following:
- Who is selecting records on a particular table/view?
- Who needs to be informed if I alter a Snowflake object?
- When a Snowflake object is outdated, are there still consumers who should use a new version instead?
- Can I delete a Snowflake table/view, or are there still consumers?
- What is the ratio between expensive write operations and cheap read operations on a table?
We will dig into these and other questions.
Stay tuned for upcoming blog posts!


