How to Generate Customer Success Analytics in Snowflake
- Dzone
- January 3, 2022

Here’s a quick demonstration on how to generate quick insights on customer success data in Snowflake using the platform Datameer. This post was originally published on Dzone
As the distinction between data professionals and non-data professionals becomes smaller and smaller, the need for technology that bridges the gap between the two parties is crucial. The benefits of interacting with a data warehouse, especially with large amounts of data, are unquestionable, but as a peripheral member of the core technology team who might not be very technical, it is not always practical to generate SQL queries on the fly.
This poses a problem, especially when departments such as sales, customer success, account management, etc., want the robust insights that could come from the vast amount of data that a company is storing, but they don’t necessarily know how to quickly gather these insights.
Deciding How to Analyze the Data
Datameer is a platform that sits nicely between technical and non-technical users and solves this problem. Datameer provides access to a Snowflake data warehouse with the ability to make simple transformations and joins, without requiring any coding at all. It also offers users a way to quickly add outside data sources that were not originally part of the master data warehouse – a feature that becomes very valuable when trying to quickly generate insights about customers using data from disparate sources.
Let’s take a practical example. Imagine you are the head of Customer Success at a high-growth SaaS startup. Luckily you have had enough bandwidth to stay on top of all your customers and identify high-risk accounts. However, as the company has grown, it has become more difficult to be proactive with at-risk customers and the customer health sentiment is highly subjective. You would like to move toward a more data-driven analysis despite not knowing SQL, and you are looking for a logical analysis that could update in near real-time and help drive better decision-making. You are thinking of including parameters such as user logins to the product, Net Promoter Score (NPS), and the number of support tickets. All these are disparate data sources and would require manual manipulation to aggregate the data. At this point you have a few options, such as the following:
-
Extract all the data into Excel. With the amount of user data generated this could quickly become messy with VLOOKUPS, etc., and would not be scalable. Larger datasets may also take a while to load if they load at all
-
Bring all the data directly into the data warehouse and use that as the source of record and query data within. By the time you get data warehouse access and learn SQL, you may have already lost some at-risk customers
-
Utilize a SaaS tool specifically for this use case, such as Datameer. If your user data is stored in Snowflake, Datameer is the perfect option
With the decision to go with option 3 and utilize Datameer, let’s dive into the process workflow of how it might look for you to combine all the data:
Connecting to Data in Snowflake
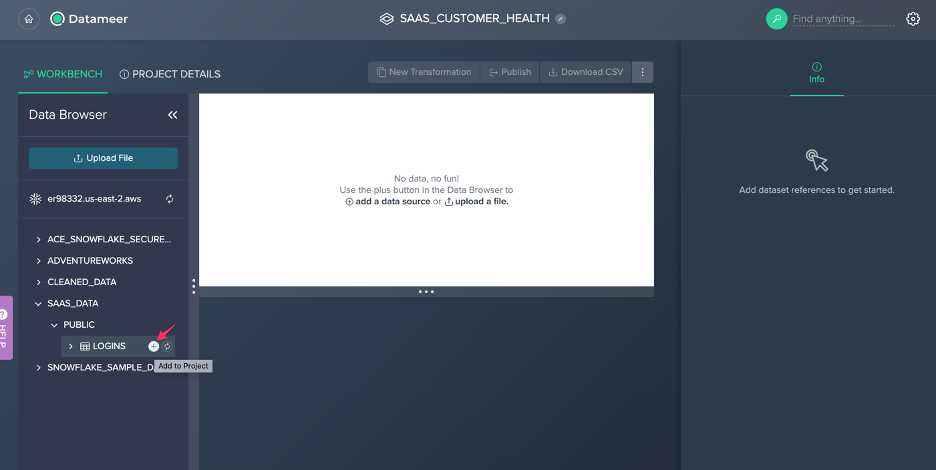
To start, we will use the table that already exists in Snowflake. For simplicity’s sake, we’ll only look at the minimum number of data points, whereas a real-world scenario could include far more information. Once you have your Datameer account set up, connect to your Snowflake data warehouse and you will see all the relevant data sources on the left-hand side. Add the one that you want to modify to your Project:
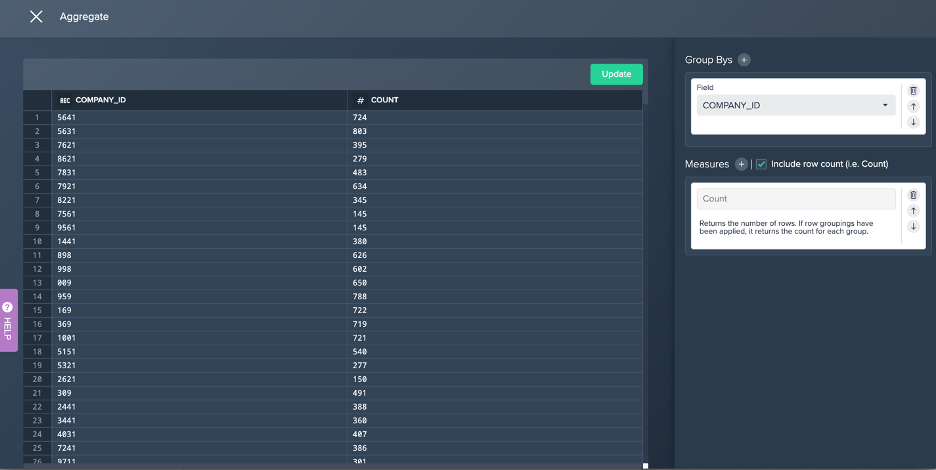
This Logins table has granular session-by-session login history with the user_id, company_id, and the date. As the simplest metric, we can look at total logins aggregated by company_id. To do this add a new “Aggregate” transformation, group by the company_id, and select row count as the measure:
Uploading and Joining Data from an Offline CSV File
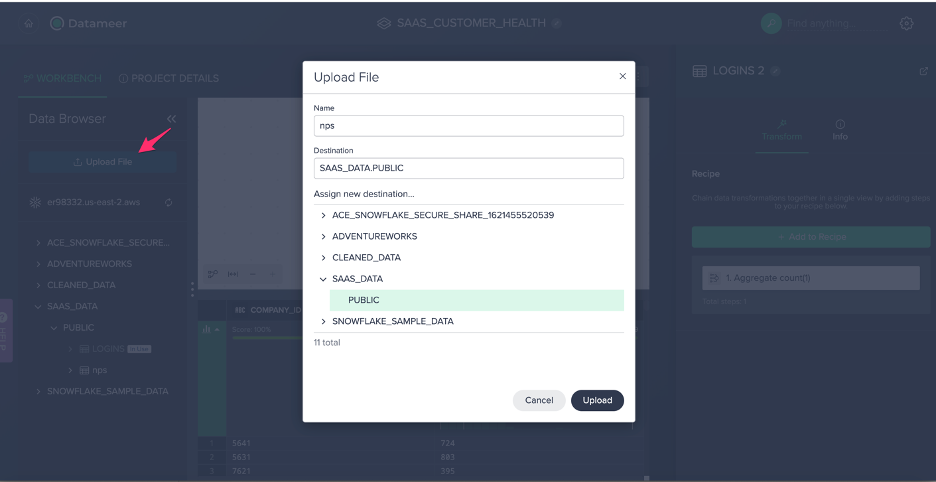
At this point, you can easily tell what companies are the most engaged going solely off of the number of logins. However, you want to take it a step further and overlay the customer sentiment from the most recent NPS survey, which you have in an excel sheet. To add this sheet to Datameer, simply upload the file in the Data Browser and choose the source-destination in Snowflake:
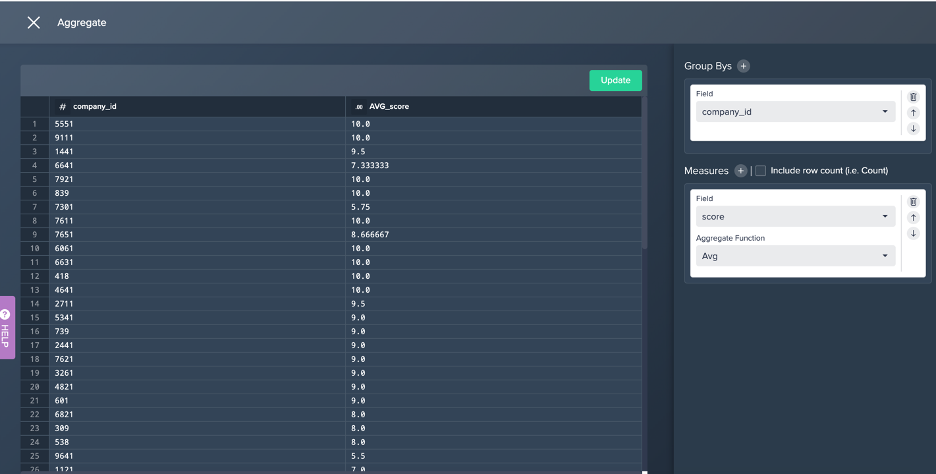
Add the new data source to the project, and again add a transformation grouping by company_id, but this time aggregating by average NPS:
Now that you have both logins and NPS aggregated at the company_id level, you can add a new transformation joining the second step in both recipes by the company_id (if you prefer to only see companies that have answered the NPS survey, select inner join instead of outer join):
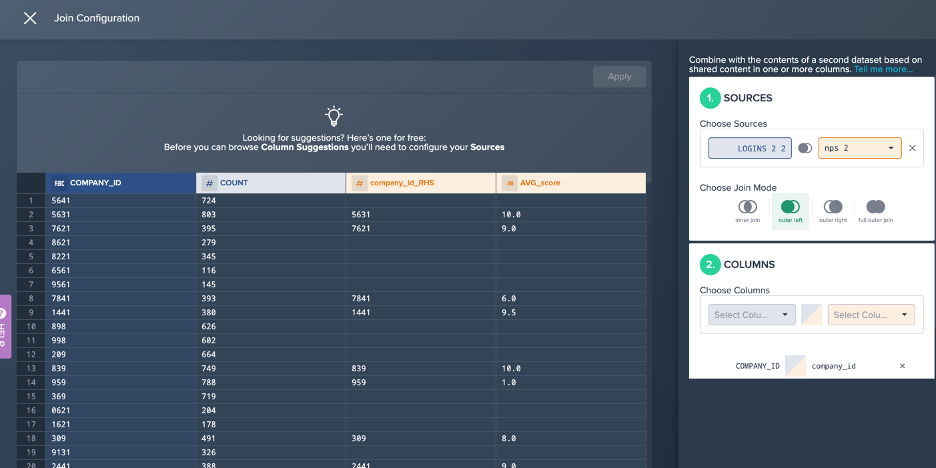
You now have one dataset with the company_id, number of logins, and average NPS score (if applicable). For clarity we can rename this step as “LOGINS + NPS”, and also remove one of the company_id columns, as it is duplicated:
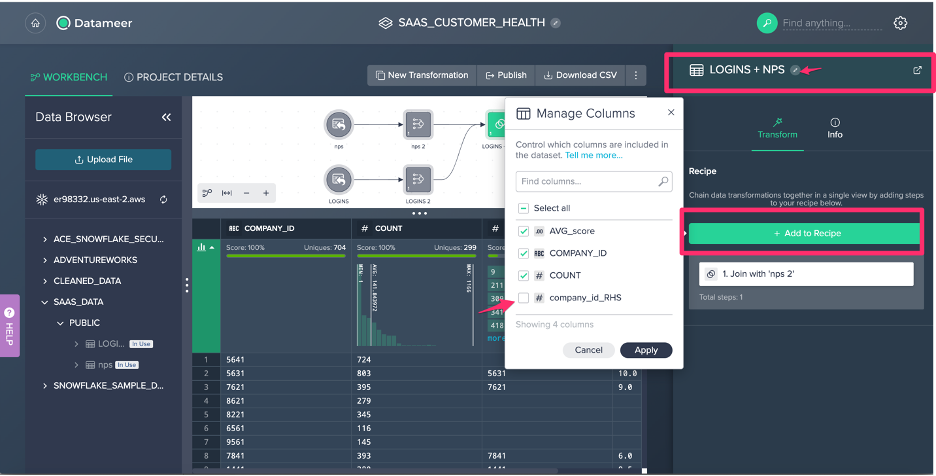
We now have a perfect building block for a customer health analysis.
Adding One More Data Source and Tying It All Together
We can add one more data source to build in a bit more detail, and then publish this back to Snowflake. As a Customer Success Manager, you may want to know how many support cases clients are submitting. On the one hand, the more support tickets submitted, the more issues the client is probably dealing with.
On the other hand, more support tickets show that the client is truly engaged, and there is nothing worse than a client with 0 support tickets and only learning of their lack of engagement when it is time to renew their account. For this example, support tickets are stored in Salesforce and the Salesforce instance does not talk back to the Snowflake data warehouse. The best way to extract this data is via a csv export from Salesforce.
Once you have the csv extract from Salesforce, follow the same steps to upload the Salesforce tickets that you used to upload the NPS survey responses. Add it to the project and use the same transformation that you used in the Logins step to get the total count of tickets, grouped by company_id. Now that you have this dataset, go back to the “LOGINS + NPS” dataset that was joined before, and join the salesforce tickets dataset. The final product looks more or less as so:
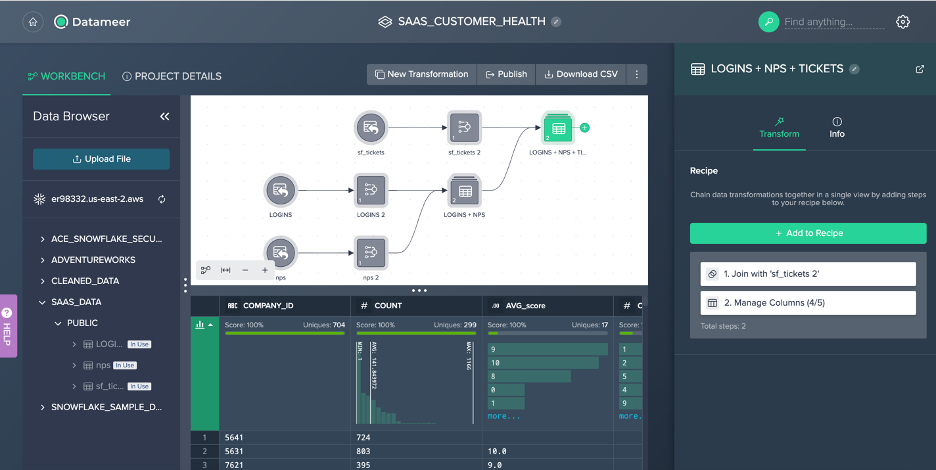
Hit the “Publish” button above the diagram, and you now have your data cleaned and back in Snowflake. This cleaned and aggregated data can now easily be used in other tools, such as in Tableau. For example:
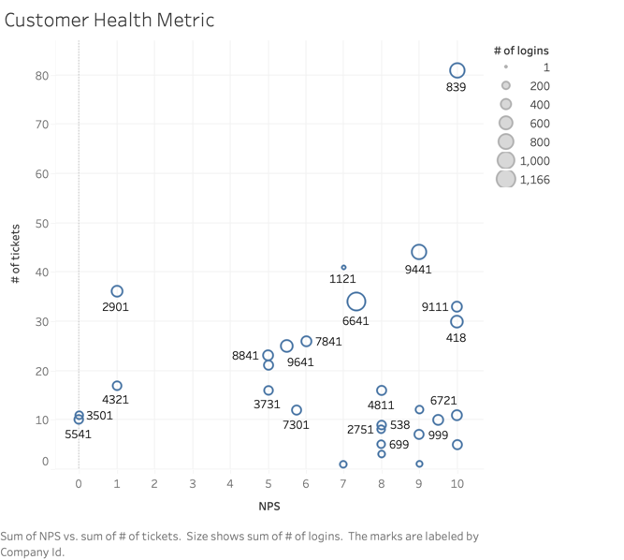
Here you can see all the inputs loaded into Datameer, and you can easily compare each customer’s health. For example, company 839 has a perfect NPS score, has by far the largest number of tickets submitted, and has a relatively high number of logins (indicated by the size of the circle). On the other hand, the companies on the bottom left of the chart (5541, 3501, 4321) are not favoring well and you may need to set up a meeting with them or learn some tricks from the way company 839 is handled.
Without Datameer, joining these datasets and ultimately visualizing them in Tableau and calculating fields would not only be complicated but may result in performance issues. By preprocessing the datasets in Snowflake, end users are able to experience better performance on their Dashboards.
Conclusion
Overall, you can now see how easy it is to utilize Datameer to perform normally complex data manipulation; this tool is a perfect gateway to data analysis for non-technical users with a simple UI interface. And for more technical users, Datameer also offers the option of a SQL query builder if you prefer to write the code yourself. Customer health analysis is just one application of the software, and the possibilities become endless as your company’s data grows over time.


