How to create a rolling average with table calculations in Looker?
- Looker FAQs
- January 21, 2018

Let’s understand this in two parts.
Part 1: What is a Moving Average?
If we want to calculate the average price of a Company’s Stock in the last three days, we will add the price for (Day 1 + Day 2 + Day 3) and divide them by three. In the case of the moving averages, we would keep the time period constant, but we will calculate the average with the latest available data.
For example: Assuming we need to calculate the 3 days moving average of company stock, here is how the moving average would look like for Day 3, 4, and 5: (here Day 1 denotes the price of a stock on Day 1, and so on)
- Day 3 Moving Average = (Day 1 +Day 2 +Day 3) / 3
- Day 4 Moving Average = (Day 2 +Day 3 +Day 4) / 3
- Day 5 Moving Average = (Day 3 +Day 4 +Day 5) / 3
This is highly useful for technical analysis and is widely leveraged by major Financial Institutions.
Part 2: Implementation in Looker
In Looker, we can create moving averages with Table Calculations using the function offset_list() . It takes three arguments:
offset_list: (column to get offset values from, how far from the current row to start offset, time period )
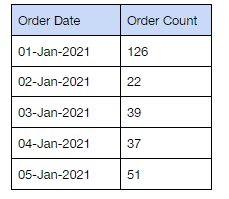
For example, we have the following table with orders for a given date, and we need to calculate the rolling 7 day average of the number of orders per day by using offset_list to identify the last 7 days of orders.
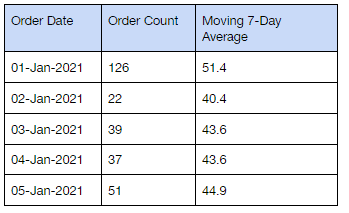
Now we will create a table calculation called “Moving 7-Day Average” with the following formula:
Moving 7-Day Average = mean ( offset_list ( ${orders.count}, 0, 7) )
The output of the above table calculation will be as follows:
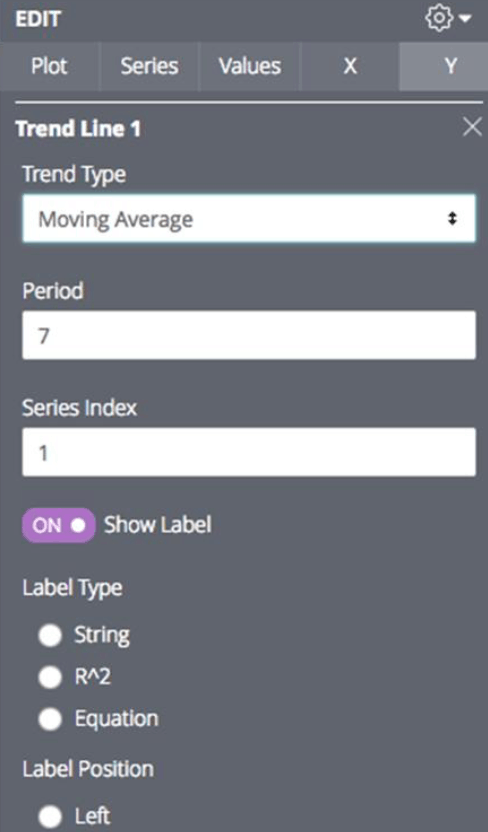
Alternatively, Looker can also generate moving averages using the trend line feature available in the visualization edit panel. If you are using a line graph or a bar chart visualization, the moving average feature will be found in the y-axis tab as shown in the screenshot below:
Please note : Regardless of what you are using, trend lines, or table calculations, Looker will by default ignore null values while calculating moving averages. However, this behavior can be adjusted by treating nulls differently in the table calculation. You may want to use a coalesce function in this case.
Up Next:
Read How to do conditional formatting of color or images within table cells using HTML in Looker?