How to create a Pivot Table in Alteryx
- How-Tos FAQs
- March 23, 2021

Pivot tables are a very useful tool in Microsoft Excel used to group and summarize data of a more extensive table within one or more discrete categories. This summary might include sums, averages, or other statistics, which the pivot table groups together using a chosen aggregation function applied to the grouped values. Let’s explore how to create a pivot table in Alteryx.
In Alteryx there is not a specific function to create a Pivot Table but we can reach the same result in a very simple way, we can use a Summarize tool to aggregate data vertically
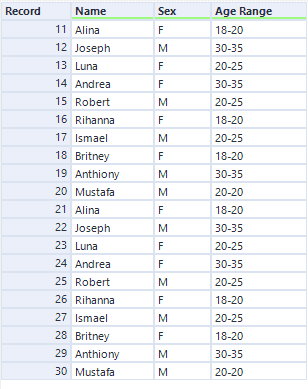
For this example, we have a database made up of three fields (Name, Sex, Age Range) as shown below
The aim is to have a database made up of three different field (‘Age Range’, ‘Sex’, ‘Count_Sex’) because we want to know in each ‘Age Range’ how many men and how women there are.
We can use Summarize tool to handle with this
Summarize tool
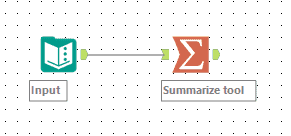
Using a Summarize tool is the best way to aggregate data vertically to create some sort of Excel’s Pivot Table.
- Connect a Summarize tool directly to your workflow
- In the configuration tool we have two different sections:
- In the first one all the database’s fields are shown (Fields)
- In the second one all the fields contained the output will be displayed as we add them, they will be displayed in the same order they will be put in the output (Actions)
- Select ‘Age Range’ from the first section and add it to the Actions with ‘Group by’
- Select ‘Sex’ from the first section and add it to the Actions with ‘Group by’
- Select ‘Sex’ from the first section and add it to the Actions with ‘Count’
The Actions section should appear as shown below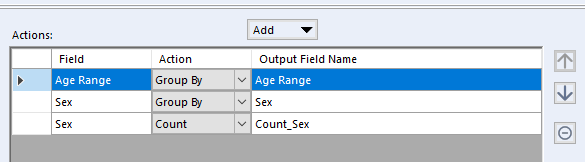
In this way we will get:
- Field ‘Age Range’ where any unique age range will be shown
- Field ‘Sex’ where any unique sex available in the corresponding age range will be shown
- Field ‘Count_Sex’ where the corresponding count for each sex in each age range will be shown
The ending database should appear as shown below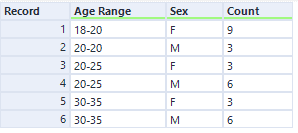
Now we know how many men and how women there are in each ‘Age Range’.
We have seen a very simple way to aggregate data vertically in Alteryx through the Summarize tool .
Obviously, ‘Group by’ and ‘Count’ are not the only actions available in the Summarize tool, here there is a list of the most common and useful available actions.
- Group by
- Sum (only numeric)
- Count/Null/Non Null
- Count Distinct/Non Null
- Min/Max
- First/Last
- Percentiles (only numeric)
- Descriptive statistics (only numeric)
- Concatenate (only strings)
- Shortest/Longest (only strings)
Please note that some actions are available only with specific data types, not logic actions for a specific field will not be selectable. And that’s how to create a pivot table in Alteryx.
Continue reading:
Check out: How to check if values from one field exists in a different field in Alteryx


