Data Aggregation: An Explanatory Guide
- Jeffrey Agadumo
- February 1, 2023
Looking to manage and make more sense of your large datasets? Data aggregation is one exciting way to go about it.
Data aggregation means collecting, sorting, and organizing raw data to make it more meaningful and easy to analyze.
This article covers the following:
- What is Data Aggregation?
- The Processes of Data Aggregation.
- Data Aggregation in ETL.
- Top Data Aggregation tools
Join me as we explore this subject in more detail below!
The Age of Data
As more organizations turn to cutting-edge analytics strategies to gain a holistic view of their operations, it is no longer news that more data is being collected today than ever in history.
It is often difficult to make sense of this extensive data in its raw form, so it needs to be cleaned, grouped, and summarized in a way that highlights essential patterns or trends.
That’s where data aggregation comes into play.
What is Data Aggregation?
Data aggregation is collecting, organizing, and summarizing chunks of raw data from multiple sources to make it more meaningful and personalized. This enables analysts to adequately improve the usability of data and the quality of insights you can get from it.
Examples include calculating the average set of numbers, summing up totals, or counting the number of occurrences of the same data.
Data aggregation is often used to prepare data for further analysis or to create stakeholder summary reports.
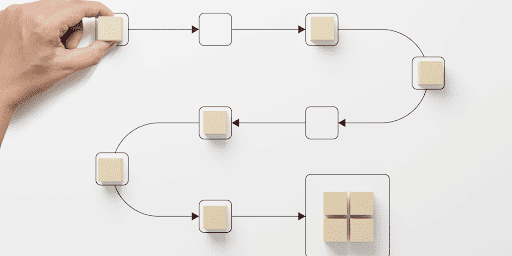
Data Aggregation Process
Aggregation of data usually involves a series of processes that you can follow to maximize the quality of data generated for cleaning, transformation, and analysis:
These processes include:
I. Collection
Gathering related data from various sources, like databases, websites, social media, and sensors .
Usually, web crawling frameworks, web scrapers and spreadsheet applications like Google Sheets, Talend, and Alteryx are employed.
Some organizations may already have data -such as sales and marketing data – available from different sources.
II. Cleaning
Cleaning consists of removing the parts of the data that are redundant or inaccurate.
III. Integration
Compiling data gotten from different sources into a single data set.
Compiled data sets are usually stored in cloud-based central data warehouses like Snowflake , Amazon Redshift, Google BigQuery, and Azure Synapse Analytics.
This step may involve transforming the data to establish consistency and compatibility across the board.
IV. Consolidation
Reduction of the dataset to more concise and manageable sizes by summarizing or aggregating the data. You can reduce numeric values through aggregate functions.
V. Analysis
Exploring the summarized data to discover new trends and patterns that provide stakeholders with insights for better decision-making.
VI. Visualization
Creating visual models like charts, maps, and graphs for presenting analyzed data in an understandable format.
Relationship Between Data Aggregation and ETL
Data aggregation and ETL (Extract, Transform, Load) are very closely related concepts.
As similar as the two processes may be, they have different contexts and use cases in data management.
The most significant difference between the two concepts is in the frequency with which they are applied.
The ETL process involves continuous data flow management between different systems.
We do this by creating pipelines for transporting data and essentially passing the data through processes – cleaning, transformation, analysis – to generate insights that drive better decision-making consistently.
Every time you pass your data through an ETL funnel, a version of data aggregation is implemented to ensure that you go from raw data to analyzed data, ready to guide the decisions of stakeholders.
Data Aggregation Tools
This section will look at the software used to carry out phases of data aggregation, as well as the languages we use to manipulate data – and perform aggregate functions.
Languages : When it comes to the complex manipulation of data, programming languages can be a great way to access, manipulate and mold data to your taste.
With that, here are a couple of industry favorites that are ideal for data manipulation:
1. SQL
SQL is a programming language used for managing and manipulating relational databases. One of the main functions of SQL is to aggregate data for multiple rows and return a single result. It contains aggregate functions like SUM, COUNT, AVG, MAX, and MIN used to group data into one or more columns.
2. R
R is a programming language for statistical computing and graphics visualizations. We typically use it for data cleaning, statistical analysis, and visualization.
In R, data aggregation uses various functions and packages, the most common for accessing aggregate functions being the ‘aggregate() ’ keyword.
3. Python
Python is a popular programming language widely used in data aggregation. It has a variety of libraries and frameworks that make it easy to manipulate and analyze large datasets. Additionally, Python has a large community of users.
Python has so many resources for learning and troubleshooting. Some popular Python libraries used for data aggregation include:
- Pandas: a library that provides data structures and data analysis tools
- NumPy: a library that provides support for large, multi-dimensional arrays and matrices of numerical data
- Scikit-learn: a library that includes machine learning algorithms
- Matplotlib: a library that provides visualization tools
- Seaborn: a library that offers a high-level interface for visualizing statistical models
- Scrapy: a library that provides web scraping capabilities
Software : No one tool performs the entire aggregation process from the beginning to the end. Thus, a combination of specialized tools helps you furnish your data at different stages of the aggregation journey.
The various software tools for data aggregation include:
1. Talend
Talend is a data integration and ETL (Extract, Transform, Load) tool that allows you to connect to various data sources, cleanse, enrich and aggregate the data, and load it into a target system. It has a wide range of built-in connectors and transformation components, and it can be used to automate data integration tasks.
2. Tableau
Tableau is a data visualization tool that allows you to connect to various data sources, create interactive dashboards and visualizations, and share your insights with others. It has a user-friendly interface and a wide range of built-in visualization options, making it a popular choice for data analysts and business intelligence professionals.
3. Power BI
Power BI is a business intelligence tool from Microsoft that can connect to multiple data sources, combine and shape the data, create interactive visualizations and share your insights with others.
4. Alteryx
Alteryx is a data integration and analytics platform that allows you to connect to various data sources, cleanse, enrich and aggregate the data, and create advanced analytics workflows. It has a drag-and-drop interface, and it can be used to automate data integration and analytics tasks.
5. Datameer
Datameer is a business intelligence software that allows users to clean, analyze and visualize large amounts of data. Datameer can connect to a wide variety of data sources, including structured and unstructured data, and is most suited to handling large datasets with millions of rows at a time.
Wrap Up! An Ideal Data Aggregation tool
Datameer is an ideal tool for data aggregation for a plethora of reasons.
It provides its users with numerous functions for performing different phases of the data aggregation process and can effectively work on any amount of data you make available.
Datameer is such a great fit due to the following features:
Scalability
Datameer is built on top of Snowflake, which is a cloud-based data warehouse that enables the processing of data sets of any size from any device on the internet. Snowflake allows you to store datasets of any size and scale your storage infrastructure up if necessary.
User-Friendly Interface
Datameer provides a user-friendly interface allowing business users to connect easily to data sources, prepare, explore, visualize data, and perform advanced analytics.
Advanced Analytics Capabilities
The platform provides advanced analytics capabilities such as machine learning, predictive modeling, and natural language processing, which can help businesses gain deeper insights from their data.
Data Integration
Datameer supports a wide variety of data sources, including structured and unstructured data, and provides a wide range of pre-built connectors and data integrations, as well as the ability to build custom integrations, making it easy to connect to a wide range of data sources.
Collaboration and Sharing
Datameer allows users to collaborate and share insights with others, making it a valuable tool for data-driven decision-making and business intelligence across – decentralized – teams.
Data Security
With Datameer, companies can ensure the security of their data by setting up data access controls and encryption to protect their sensitive data.
Businesses need not be weary of analyzing larger data sets with Datameer. You can be sure to get your data from raw and unstructured to analyzed and visualized.
To get a first-hand experience with Datameer, get started today!


