Datameer and Amazon SageMaker Data Science Workflow
- John Morrell
- February 1, 2019

Introduction
If you’re going to do machine learning work right, you’re going to need well-honed data sets to build your models on. It is not just about cleaning up the data. It is also about discovering data that is relevant to the problem at hand, finding more data to increase accuracy, integration data from multiple sources, aggregating values etc. All of this can be achieved with the proper data science workflow.
Four of the seven stages in a data science lifecycle involve getting intimate with your data (see image). But in terms of time, these four stages can consume 90% or more of the data science analytic lifecycle.
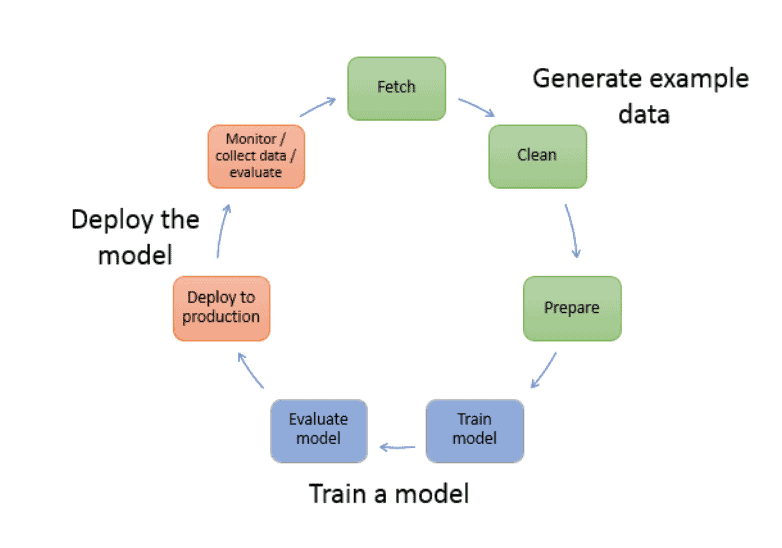
And getting there isn’t just about preparing the data. It’s about exploring it and understanding it – achieving intimacy with the data, grasping its content and meaning in a fundamental way. It takes way more than simple preparation to do that. It takes deep analysis and exploration. And that requires data preparation, data exploration and machine learning work to be done in tandem and in harmony.
This blog accompanies a white paper where we dig even deeper and show a real world example of how the combination of Datameer and SageMaker can deliver a more optimized overall workflow from shaping the data, performing the feature engineering, delivering the model, and examining its’ overall behavior. We use a data set of telematics data than can be applied to areas such as usage based insurance (UBI) and driver behavior analysis, risk assessment and pricing of auto insurance. If you’d like to jump directly to the white paper, here is a link to it:
Cooperative Workflow with Datameer and SageMaker White Paper
Today’s ML Workflow
In the world of data science today, much of the work tends to happen inside a programming and data manipulation environment called a notebook. Notebooks are Web browser-based documents that contain a combination of text (in markdown format, specifically), code, and output generated by the code.
Often times that code will be written in Python, which is a very popular language for data science work. The Python code can then be applied to different platforms and APIs containing various algorithms in the ML platform (in our case SageMaker).
Notebooks and data science tools can be used to explore, query, profile and transform data. But data scientists must write code. This has three important consequences:
- Only data scientists or data engineers, with the right coding skills, and sufficient file and database permissions can perform these tasks
- Coding can be error prone and, in the best case, is far less efficient in preparing and exploring data for data science
- It is difficult to get reuse and collaboration in such a coding environment to help the overall team be more productive across all analytic projects
With this in mind, a more efficient workflow would be to use a platform specifically designed to accelerate the difficult preparation and exploration tasks – finding the right data, exploring it to understand its’ relevance to the problem, shaping it in the right way, and engineering the features needed to make the ML model hum.
The data scientist can then use the notebook for what it is good for – creating the ML model – and using the ML platform for testing it and running in production. Once done with the ML modeling, one could also use the data exploration capabilities of the data preparation platform to validate the ML model across a number of data sets, to ensure its’ accuracy.
All three aspects – preparation, exploration and feature engineering – are essential to the ML workflow. And to perform each of these tasks requires a key set of features we will discuss shortly.
Key Data Prep Features for the ML Workflow
Datameer is an advanced data preparation and exploration platform that works especially well with big data. The features are designed to help you understand your data better, shape it in the right manner, and to explore it on a self-service basis. As it happens, many of these features make Datameer a great tool to prepare data for machine learning workloads. We review some of those features here. In the next section we’ll apply them to a particular dataset that we’ll then use to build a machine learning model.
Data profiling
Datameer’s Inspector provides data profile information in a visual format, requiring little effort to see the shape of your data. Users can see vital profiling statistics (like number of rows, number of distinct values, and the maximum, minimum and mean) on any column, just by clicking it.
Users can also see data profiling information for the entire dataset by going into Flip Sheet view. The Flip Sheet view provides a deep range of information for each column to provide a richer profile of the data.
Data profiling, especially the histograms that visualize the distribution of values in a column, is important functionality in the data science preparatory workflow. Knowing that a given column has a small number of distinct values may provide a clue that its value can be predicted by a machine learning model. If the column has a large number of distinct values, or a small number if they’re evenly distributed, then it may be important to predicting the value of another column.
Visual Data Exploration
Visual Explorer is Datameer’s patent-pending technology for performing visual exploration on large volumes of data with amazingly fast interactive performance. This allows customers to see patterns in the data and to do so in an iterative fashion.
Visual data exploration allows a data scientist to dig deeper into their data and become intimate with each attribute and value. Easy to understand charts show interesting aspects of the data and unveil patterns within the values. Unconstrainted exploration and drill down allows a data scientist to work through any paths in the data and quickly switch between different attributes and metrics for truly agile discovery.
The ability to do this on large volumes of data is very helpful in the creation of accurate data models for which mere sampling of data must be avoided. This quickly encourages users to investigate their data tenaciously, since they can ask question upon question with little if any waiting time. Once a user has explored a specific path in the data and found something valuable to their model, they can then create a refined dataset with the click of a single button.
Algorithmic Exploration
Another way to explore and shape your data is to apply algorithms and statistical functions that reveal patterns. Using this approach, a data scientist can unveil patterns that they would never had seen with standard aggregations and can use these patterns for feature engineering tasks.
Datameer’s Smart Analytics offers a focused set of built-in algorithms that reveal advanced patterns in the data. For example, one can view the relationship between columns and the impact it has on others with column dependencies. Users can also create decision tree to see how data columns or values relate to an outcome.
Datameer also offers a rich suite of statistical and advanced grouping functions that can help users explore the shape and values of their data. All of this is extremely important to aid the feature engineering process.
Easy to Follow Data Science Workflow
Beyond these exploration features, working with data in a spreadsheet and formula environment is highly congruent with the machine learning preparatory workflow. In Datameer, data is loaded into one sheet then gradually transformed and summarized in successive sheets in the workbook.
This leaves the lineage of the data fully visible and discoverable. In effect, each tab of the workbook is a chapter in a story of the data’s evolution, essentially a presentation of the progressions in the analyst’s thought process in working with the data.
In some ways, the cells of a Datameer workbook are like the cells in a Data Scientist’s notebook. Each one allows a set of transformations on, and/or analyses of, the data. The difference is that notebooks have code, while a Datameer workbooks has data rows and columns with easily readable spreadsheet formulas as well as simple filters, sorts, joins and unions.
Rich Suite of Functions
Another major part of feature engineering is creating new columns from the source data to feed the right columns and values to the AI/ML model. Doing so requires a comprehensive and large suite of easy to apply functions to that transform and aggregate data as well as calculating new values based on statistical or calculation functions.
Datameer offers over 270 powerful, yet simple to use functions to transform and massage the data into the right shape. These elements provide much of the same expressiveness and power of code, but on declarative functions instead of imperative stepwise lines of code. They’re accessible to more authors and more readable for a broader set of consumers.
These powerful spreadsheet-style formulas will come in handy when performing feature engineering. ML models typically require numerical, statistical and encoded values. We can apply transformation, calculation and statistical functions to the core data to produce new columns that provide highly tuned values to the ML model in the right format.
See a Real World Example
The combination of Datameer and SageMaker can deliver a more optimized overall data science workflow from shaping the data, performing the feature engineering, delivering the model, and examining its’ overall behavior. The combination takes many of the code-intensive aspects of the process away to not only speed the total workflow, but also gain re-use across projects and collaboration among the data science teams. Datameer’s integration with the rest of the AWS platform, including EMR, provides the scalability, security and governance for extensive data science programs.
In this white paper, we illustrate how to create a more efficient and effective ML workflow that can be done with a rich data preparation and exploration platform – in this case Datameer – combined with a machine learning platform – in this case Amazon SageMaker. We’ll also show how the cooperative relationship can work both ways – with data being sent from Datameer to an ML platform to build and test models, then the results of those tests and predictive output from the models fed back into Datameer for further exploration. We’ll show how this loop can repeat iteratively – setting up a virtuous analytics-ML workflow cycle.
In our example, we will use a data set of telematics data than can be applied to areas such as usage based insurance (UBI) and driver behavior analysis, risk assessment and pricing of auto insurance. We will prepare, explore and feature engineer an optimal dataset, then use a random forest model to identify trips that are not driven by the insured driver to determine cases where this occurs and identify where this might introduce increase risk.


