Blending Data to Solve for Marketing Analytics ROI: An E-Commerce Analytics Use Case with Datameer
- Datameer, Inc.
- July 17, 2021

CMOs are always asked for their marketing and ad-spend ROI but technology is against them. With different tools hosting a different set of marketing data, CMOs are left to resort to even more technology to solve this data puzzle.
A typical e-commerce company would have marketing data spread across multiple systems:
- Transaction data in an e-commerce platform such as Shopify or Magento
- Advertisement spend data in individual ad platforms such as Facebook, Google, Instagram, Youtube, and more
- Attribution data, i.e., which channel/campaign drove how many transactions in a platform like Google Analytics
- Customer demographics and lifetime spend data from a CRM system such as Salesforce or Hubspot
Advanced and mature marketing organizations would then use data pipeline tools like Fivetran, Talend, Stich, etc. to load and replicate all these different data sources in a central data warehouse repository such as Snowflake.
These data sources (Shopify, Salesforce, Hubspot, Google analytics, Facebook Ads etc.) would each be stored in different snowflake tables, and marketing analysts would use a tool like Datameer, to join and blend these data sources, to create a data set that fits their analytics need.
Let’s look at our ad-spend ROI analysis example. The ROI formula looks like this:
ROI = (12-month customer spend / Cost Per Acquisition) – 1
Now what a CMO might break down this ROI analysis by age group (which age group returns higher ROI), gender (which gender might return higher marketing ROI), campaign or channel (which campaign, or which ad platform returns higher ROI).
Data Required
Here’s the data the use case under discussion uses,
- Customer Profile (Source: Salesforce)
- Demographics (age and gender)
- Purchase History – Date of acquisition, subsequent purchases, 12-month spend since acquisition
- Ad Spend (Source: Individual Ad Platforms)
- Facebook Ads, Google Ads, Other display and social channels
- Customer Acquisition Data
- Number of customers acquired by channel and campaign (utm parameters) (Source: Google Analytics Last Non-Direct Touch Attribution)
- Acquisition Channel (utm parameters) for each customer (Source: Shopify)
Data Transformation and Preparation
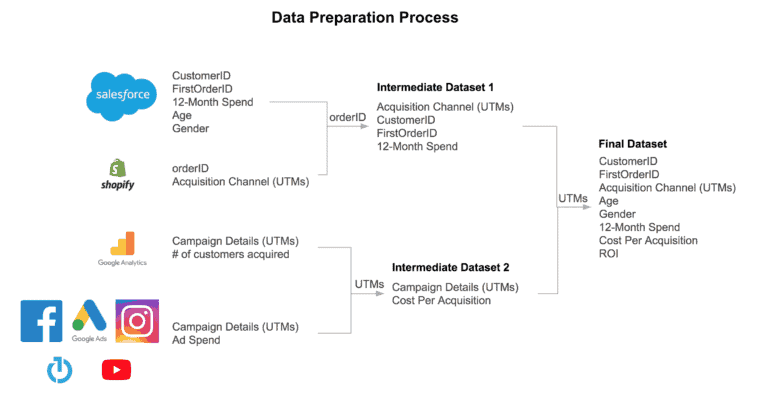
In the final dataset we require the following information for each customer – customer ID, Age Range, Gender, 12-month spend since acquisition, Acquisition Channel, Acquisition Campaign, Cost per Acquisition for the channel and campaign, Computed ROI. Blending the various sources requires us to have at least one column between data sources we intend to blend. We could blend the datasets mentioned above on matching columns as follows to create the final dataset.
- Shopify and Salesforce data on order ID to create an intermediate dataset, say Intermediate Dataset 1
- Google Analytics and Ad Spend data on utm parameters for campaign and channel to create another intermediate dataset, say Intermediate Dataset 2
- We then create the final dataset by blending IntermediateDataset1 and IntermediateDataset2 on utm parameters
Analysis and Insights
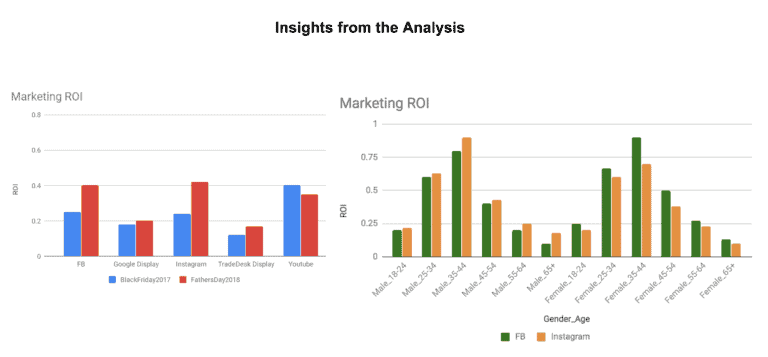
Once we have the final dataset, it can easily be analysed in Excel or any Business Intelligence (BI) tool such as Tableau or Looker to get granular insights on who the high LTV customers are and which channels and campaigns have been responsible for acquiring them. Here are a few examples of insights that can be derived from such an analysis.
- 25-44 year old customers drive the highest ROI over their lifetime, with women driving a slightly higher ROI than men in this age group
- Facebook drives higher ROI among women, while Instagram does so among men
- Heavily promotional Black Friday campaigns drive lower ROI than Father’s Day campaigns
One can get more granular and slice channel and campaign data by demographics to see which channels and campaigns have driven the highest ROI among which gender and/or age group. Insights such as these can help marketing teams allocate the appropriate budget to specific channels and campaigns and fine-tune the audiences that the campaigns are targeting. One could also think about bringing in other customer data such as engagement with email marketing programs or transactional emails to see the incremental impact of these on LTV. The breadth of insights is limited only by the breadth of one’s hypotheses and the actionability of the insights.


