How to track churn rate over time in a Tableau dashboard?
- Tableau FAQs
- December 13, 2018

How do I create a trend line in Tableau to show the churn rate over the last 6 months that updates dynamically?
To calculate the churn line for the last 6 months, you can follow these steps:
1. First, we need to calculate sales for the last 6 months; for this, we need to use the WINDOW_SUM function and specify the offset:
window_sum(sum([Sales]),-5,0)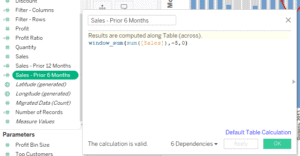
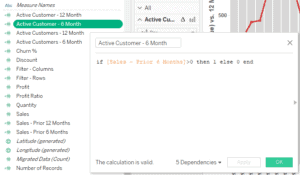
2. Next, you need to count the number of customers in the last 6 months:
if [Sales - Prior 6 Months]>0 then 1 else 0 end
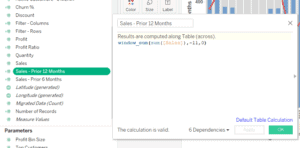
3. Then, you need to perform the same calculations for a 12-month interval:
window_sum(sum([Sales]),-11,0)
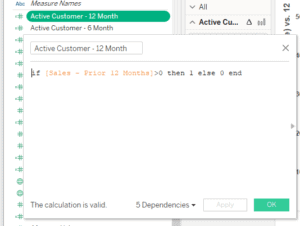
4. The same steps must be followed to find active clients in the last 12 months:
if [Sales - Prior 12 Months]>0 then 1 else 0 end
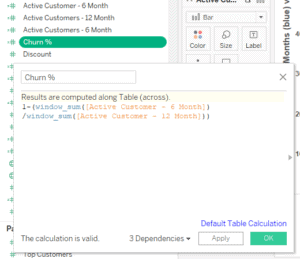
 5. Now we have everything, and we can calculate the Churn Rate using the following formula:
1-(window_sum([Active Customer - 6 Month])/

window_sum([Active Customer - 12 Month]))
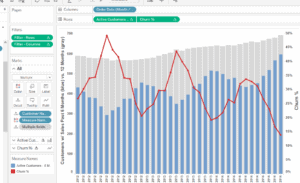
6. In the end, you need to add all the necessary metrics to the bar chart, and as a result, you should get the following:
Up Next:
Read How can I increase the size of the pie chart without changing its shape in a Tableau dashboard?