How do I show the percentage and count on the stacked bar chart in Tableau without using a dual-axis?
- Tableau FAQs
- December 13, 2018

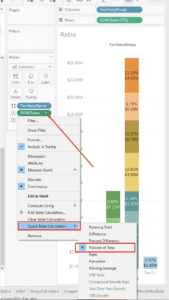
- First, you need to add all the required measures to the graph. I used Sales by Territory.
- Then you need to select the metric that you added and select additional calculations as shown in the image:
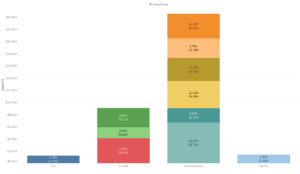
- Then add the same measure again, and then you get the following result:
Up Next:
Read How to track churn rate over time in a Tableau dashboard?