How do I expand or collapse a dimension in a Tableau dashboard?
- Tableau FAQs
- December 13, 2018

Or, put another way, does Tableau support a feature to expand/collapse a dimension shown in a dashboard in order to allow users to interact with the dashboard and (dis)aggregate info as needed?
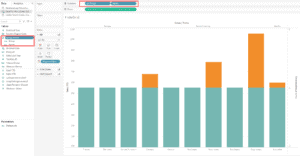
You can create your own hierarchies by dragging one dimension on top of another in the data window (list of dimensions and measures on the left side of the screen). Alternatively, you can select multiple dimensions with the mouse and Ctrl key, right-click, and select Create Hierarchy. Now when you add the top-level dimension to the hierarchy, you can navigate to the lower levels using the + button in the view.
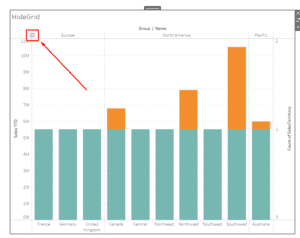
To interact with the chart on the dashboard, you can use the following buttons: