How to plot Latitude and Longitude from Google Sheets into Looker?
- Looker FAQs
- January 20, 2018

This post shows how to use Google Sheets to get latitude or longitude and then map them into Looker.
To achieve this, first, we can deploy a script in Google Sheets that would convert an address into Latitude and Longitude.
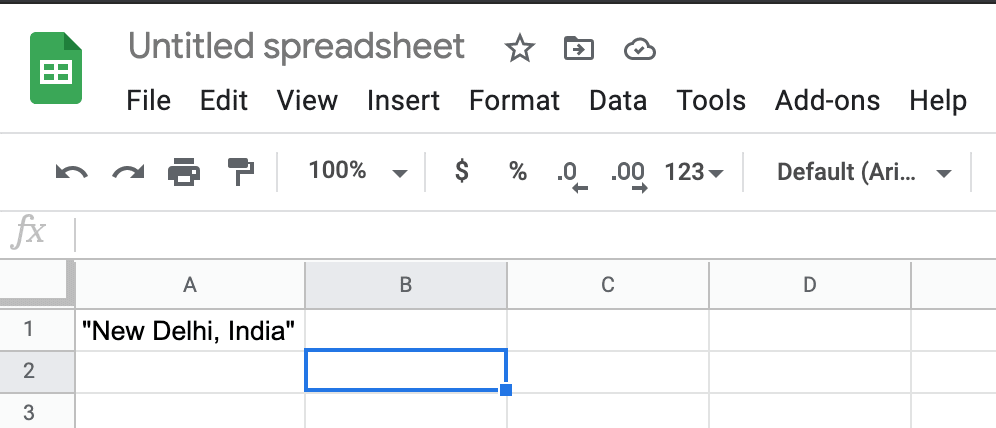
- In your Google Spreadsheet, enter the address in the first column as follows:
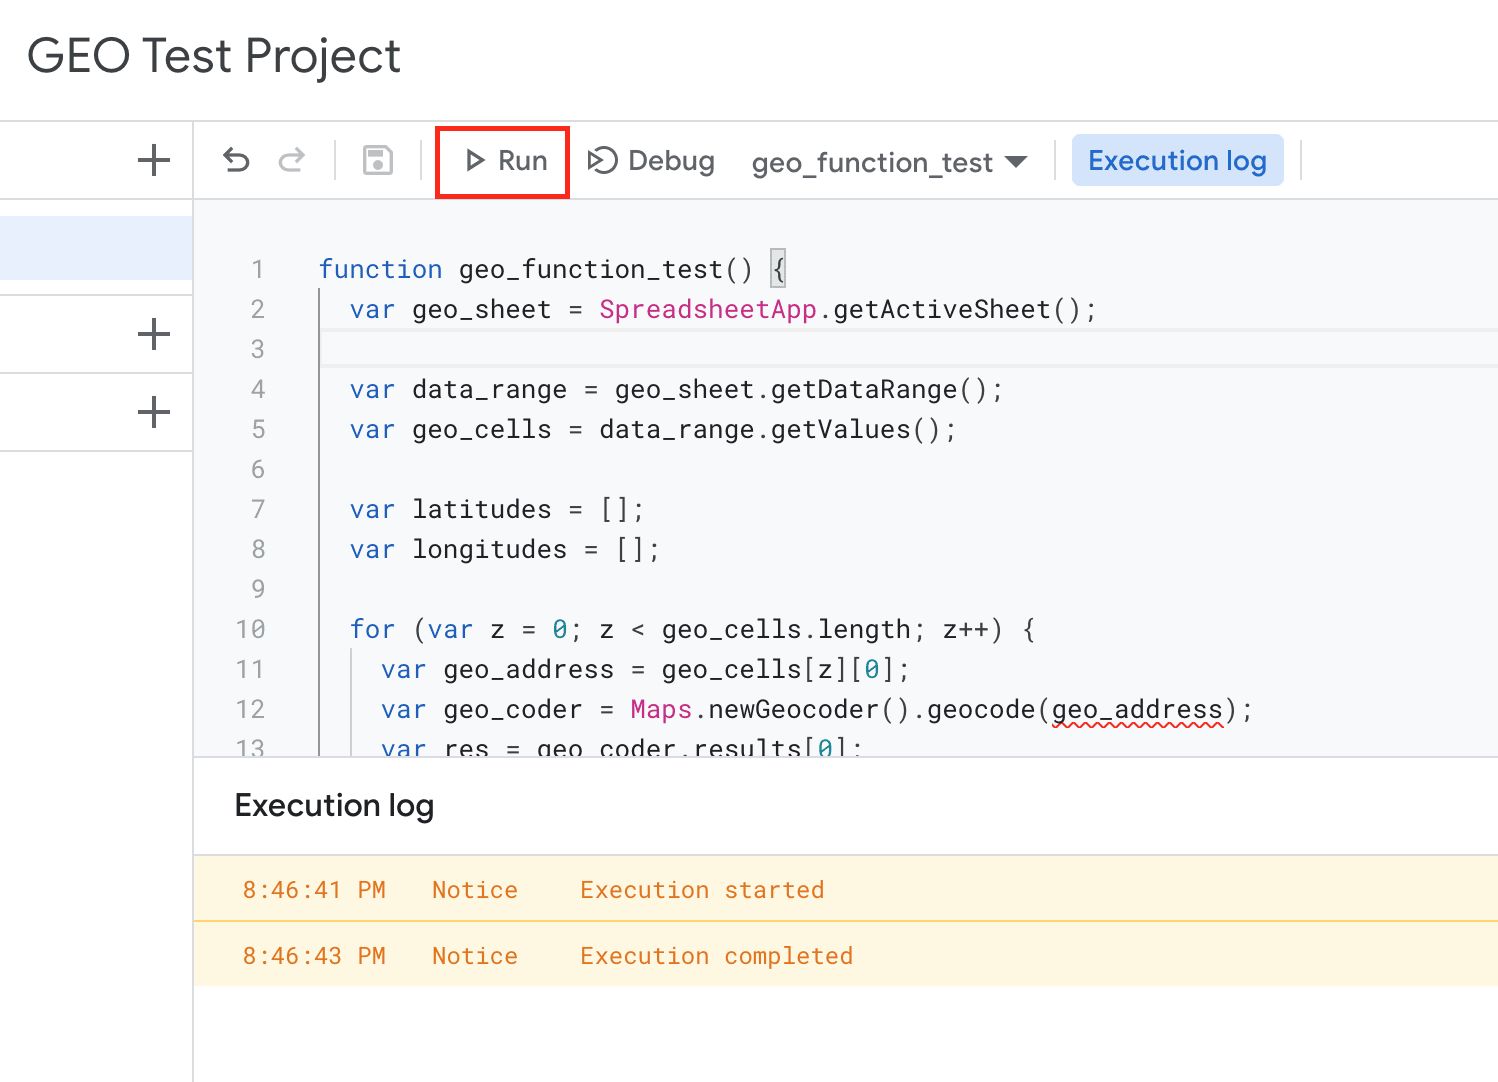
- Now go to Tools and then click on Script Editor.
- Copy and paste the below code in the editor:
function geo_function_test() {
 var geo_sheet = SpreadsheetApp.getActiveSheet();
 var data_range = geo_sheet.getDataRange();
 var geo_cells = data_range.getValues();
 var latitudes = [];
 var longitudes = [];

 for (var z = 0; z < geo_cells.length; z++) {

   var geo_address = geo_cells[z][0];
   var geo_coder = Maps.newGeocoder().geocode(geo_address);
   var res = geo_coder.results[0];
   var lat = lng = 0;

   if (res) {
     lat = res.geometry.location.lat;
     lng = res.geometry.location.lng;
   }

   latitudes.push([lat]);
   longitudes.push([lng]);
 }

 geo_sheet.getRange('B1')
 .offset(0, 0, latitudes.length)
 .setValues(latitudes);
 geo_sheet.getRange('C1')
 .offset(0, 0, longitudes.length)
 .setValues(longitudes);

}
- Save this as a new project.
- Run this script by hitting the run button.
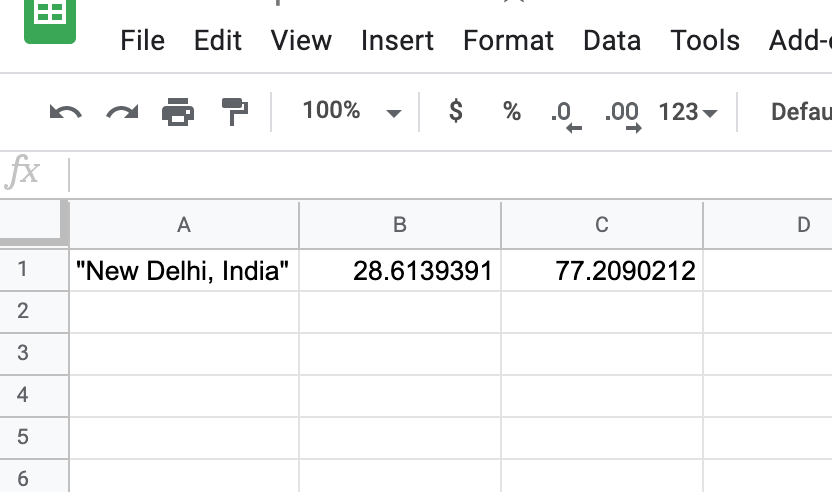
- The coordinates should appear in the next two columns as follows:
Once you have the Longitude / Latitude coordinates, you can load this data into a table within your choice database. Using the table, we can create a view called location and join this view with any table containing area codes, which would allow us to plot the areas on a map easily.
Up Next:
Read Is it possible to tie a dashboard filter in Looker to multiple fields in the same Look?