Datameer FAQ
Get answers to your questions about Datameer, the data preparation and analytics platform designed to help you quickly and easily access, integrate, and analyze your Snowflake data.
Datameer is a data preparation and analytics platform that enables users to easily access, integrate, and analyze their data. With Datameer, users can prepare and transform their data using a visual interface or custom code, and perform advanced analytics and machine learning to derive insights and make data-driven decisions.
Datameer was built specifically for Snowflake. Directly upload your CSV files to Snowflake through our Datameer CSV uploader.
Datameer offers the same powerful data preparation and analytics capabilities as the on-premises solution but with the added benefits of scalability, flexibility, and ease of deployment. With Datameer, users can quickly provision and access their data without having to worry about infrastructure management and benefit from the latest security and compliance features. For more info check out our Why Datameer page
To get started with Datameer, you can sign up for a free trial or request a demo. Once you have access to the platform, you can connect to your Snowflake account, prepare and transform your data using the visual interface or custom code, and perform advanced analytics and machine learning. Datameer also offers comprehensive documentation, tutorials, and training resources to help users get started quickly.
Datameer offers a range of support options for users, including a support portal, training and knowledge base. Additionally, Datameer provides dedicated support for enterprise customers, including a customer success manager and immediate support for critical issues.
Datameer is compatible with Snowflake’s cloud data warehouse and its integrations. Some of the popular integrations include:
- BI and data visualization tools like Tableau, Power BI, Looker, and Qlik
- ETL and data integration tools like Informatica, Talend, Fivetran, Matillion, and Stitch
- Data governance and security tools like Alation, Immuta, and Varonis
- Popular sharing tools like Google Sheets, Email, CSV, Slack
While Datameer itself is not a data integration tool, it can help users prepare and transform their data for use in Snowflake and can integrate with a range of BI and data visualization tools for analysis and reporting.
Datameer is priced per seat. To get specific pricing details for your business needs, please contact us and our team will be happy to assist you.
Datameer pushes everything down into Snowflake.
Datameer connects to Snowflake data warehouse and uses its distributed computing architecture to ingest, process and analyze the data, leveraging Snowflake’s capabilities for parallel processing and scalability.
Datameer Resources
Explore our product resources to assist you in starting with Datameer.
Datameer Docs
Datameer’s documentation provides comprehensive user guides, tutorials, and other resources to help you effectively use the platform.
Customer Support
Datameer’s customer support team is available to assist with any issues or questions you may have about the platform.

Why Datameer
Discover why leading enterprises choose Datameer for their data needs, and learn how our platform enables users to quickly extract insights from complex data.
Read the Product Description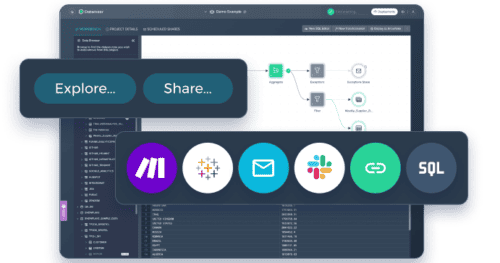
Datameer Cloud
From building queries to creating pipelines & reports, Datameer Cloud's features make us your team's go-to tool for analyzing Snowflake data.
Read the Product Features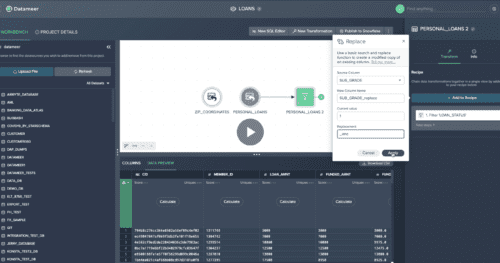
Datameer Demo Center
Datameer Demo Center is your self-service resource to maximize Datameer. Watch demo videos on how to start transforming your data.
Read the Product Videos