UFO Sightings
Infographic
This app analyzes the UFO sightings data available from Infochimps (http://www.infochimps.com/datasets/60000-documented-ufo-sightings-with-text-descriptions-and-metada ). This dataset contains the time and date of UFO sightings and reports, the location, the shape of the UFO, the duration of the event and a text description of what happened. The app analyzes this data. In particular, it performs the following operations:
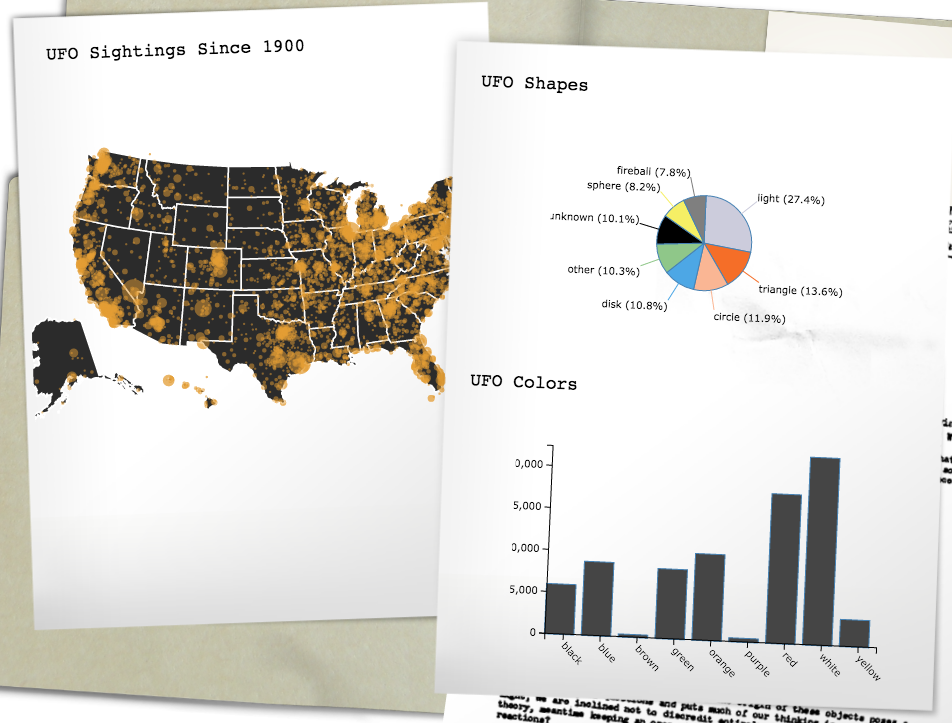
- It groups the UFO sightings by the shape attribute and computes the number of sightings in each group.
- It extracts the city and state information from each sighting. It then looks up the cities in the GeoLite database (http://www.maxmind.com/app/geolite) and determines latitude and longitude information for each sighting. Finally, it computes the number of sightings for each individual location.
- It extracts the words occurring in the descriptions of all sightings. It then filters all words that describe colors and computes how often each color occurs.
The UFO sightings infographic displays the information computed by the workbook: a map with the locations of all US sightings, a pie chart with the distribution of shapes and a bar chart showing the colors used in the descriptions.
Connection and Import
The app uses two connections: both connections use the http protocol to download datasets from the web. "Examples from Infochimps" is configured to connect to the Infochimps server, while "Examples from S3" connects to a server on Amazon S3. The corresponding import jobs download the UFO sightings dataset in JSON format and the geolocation data as CSV file. The list of colors to be used in the "UFO Colors" chart is contained in the "Colors" file upload.
Workbook
The "UFO Sightings" Workbook provides the data for the three charts in the Infographics. For the "UFO Shape" chart, The number of shapes is computed by grouping and sorting sheets ("Shapes" and "TopShapes"). The locations are joined with the GeoLite database ("locationJoin") to obtain the longitude and latitude information and then grouped by city name to avoid duplicates ("Dedupe"). To obtain a count of the colors occurring the UFO description texts, the workbook extracts single words from the text ("WordsInDescription"), groups the words to compute the word count, and then joins the resulting word list with the list of colors ("ColorsDescribed").