Tutorial Click Path
Analyze Click Stream Data
Tutorial Click Path Analysis is a basic lesson on how to analyze user sessions using Datameer from the raw log files.
About the Sample Data
| Name/Description | Type | Size |
|---|---|---|
| Clickstream_Data (Weblogs) | Raw Apache Log File | 95,000 records |
| Customer_Profile | MySQL Database delivered as CSV | 20 records |
The First Dataset
The Clickstream Data is a File Upload using the Apache connector.
Parse using the pattern: %h %l %u %t "%r" %>s %b
Schema notes:
- Exclude: logName
- Change Column Title: requestTime to timeEnglishFormat
- Empty Value Placeholder: (Null, - ) without parenthesis
After the upload was completed, you can open the workbook Clickstream Analysis to view the sample data.
The Clickstream Data was filtered within the sheet Clickstream_Data where (AND):
- Request contains html
Status equals 200 (success)
RemoteUser notblank
The Clickstream Data was partitioned within the sheet Clickstream_Data for:
- All data during September 15th
- Data from 00:00 and before 03:00 on September 16th
Cleaning the logs
Duplicated Clickstream_Data and named the sheet Format.
| Ref | Column name | Formula |
|---|---|---|
| #A | IP | #Clickstream_Data!remoteHost |
| #B | User | Clickstream_Data!remoteUser |
| #C | TimeStamp | #Clickstream_Data!timeEnglishFormat |
| #D | Filename | URL_FILE(#Clickstream_Data!request) |
| #E | Status | #Clickstream_Data!status |
| #F | Traffic | #Clickstream_Data!bytesSent/1024 |
Defining a session
This sheet uses functions that define a session as a series of events with less than five minutes of time in between. Any events occurring more than five minutes apart are reported in a new session. This is done using GROUPBYGAP. This sheet also begins the process of parsing out a click path including the landing page and the exit page. This data is used in later aggregations.
This next sheet is named SessionStats.
| Ref | Column name | Formula |
|---|---|---|
| #A | User | GROUPBY(#Format!User) |
| #B | SessionStart | GROUPBYGAP(#Format!Timestamp;5m) |
| #C | SessionEnd | GROUPMAX(#Format!Timestamp) |
| #D | Clicks | GROUPCOUNT() |
| #E | Path | GROUPCONCAT(#Format!Filename;#Format!Timestamp) This ensures that your results are ordered by timestamp. *note this has a 1,000 row limit |
| #F | Mins | (#SessionEnd-#SessionStart)/60000 |
| #G | LandingPage | LISTELEMENT(#Path;0) |
| #H | ExitPage | LISTELEMENT(#Path;SIZE(#Path)-1) This is requesting the last item in a list that is the size of itself. 0 is the index reference for the first item, the last item is always the SIZE(#List)-1 |
Average user statistics
The next sheet generates some immediate insights by defining the average number of clicks a user gives to your site and what the average amount of time spent on the site is in minutes. This sheet references data generated in the SessionStats sheet.
This sheet is named UserSessionStats.
| Ref | Column name | Formula |
|---|---|---|
| #A | User | GROUPBY(#SessionStats!User) |
| #B | avgClicks | GROUPAVERAGE(#SessionStats!Clicks) |
| #C | avgMins | GROUPAVERAGE(#SessionStats!Mins) |
The Second Dataset
Customer Profile is a CSV file upload with no notable schema, quote character is ( “ ).
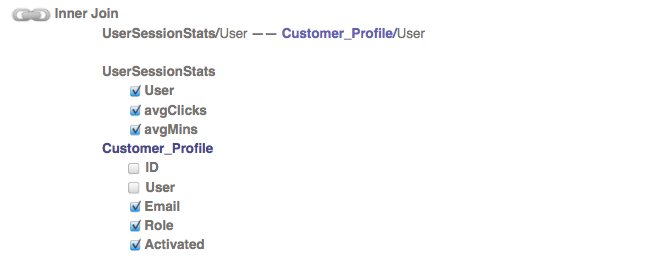
Joining the data
The data from both datasets (Customer_Profile data and UserSessionStats) are used together for analysis.
Use Join to join the Customer_Profile data source with the worksheet UsersSessionsStats. This join gives you information like email and profile role data to enrich the user session statistics that were created in the previous sheet. This sheet is named Joined.
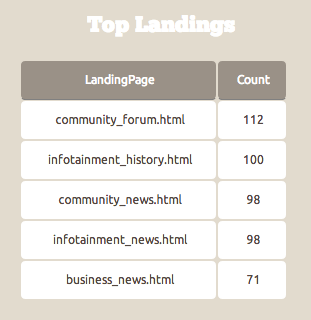
Determining the #1 landing page
This sheet tells you what the number one most popular landing page is by referencing the SessionStats sheet which pulled out the initial page visit with the LISTELEMENT function.
This sheet is named TopLandingPages.
| Ref | Column name | Formula |
|---|---|---|
| #A | LandingPage | GROUPBY(#SessionStats!LandingPage) |
| #B | Count | GROUPCOUNT() |
A descending sort on the Count column limits to the top 10.
Determining the top fallout pages
Figure out what content people are looking at when they leave your site by referencing the ExitPage from the SessionStats sheet.
This sheet is named TopFalloutPages.
| Ref | Column name | Formula |
|---|---|---|
| #A | FalloutPage | GROUPBY(#SessionStats!ExitPage) |
| #B | Count | GROUPCOUNT() |
A descending sort on the Count column limits to the top 10.
Focusing on significant visitors
Using a filter, you can focus on users that traveled three clicks or more. This sheet is named ClickPath3Plus.
From the SessionStats sheet, a simple filter is created in a new sheet where Clicks greater equals 3.
Counting the most popular paths that significant visitors follow
Here you determine what the click stream is for users who are clicking 3 or more pages throughout the site. You also determine how many distinct users followed the same path using GROUPCOUNTDISTINCT.
This sheet is named TopClickPaths.
| Ref | Column name | Formula |
|---|---|---|
| #A | ClickPath | GROUPBY(#ClickPath3Plus!Path+"") Adding the +”” Turns this LIST into a string- this is necessary to properly populate the infographic |
| #B | Count | GROUPCOUNT() |
| #C | UsersFollowed | GROUPCOUNTDISTINCT(#ClickPath3Plus!User) |
A descending sort is created on the Count column limiting to the top 10.
Click pairs and dwell time
Using similar methods used to create the general session, click pairs shows you the path a user took and the pairs of pages in that path. For example, page A to B, B to C, C to A, A to C, etc. In addition to pair trends, you can use this time series to understand dwell time on each page to answer questions like, "How long do users spend on this page before they go on to the next?". The Format sheet is referenced for clean results.
This sheet is named ClickPairs.
| Ref | Column name | Formula |
|---|---|---|
| #A | User | GROUPBY(#Format!User) |
| #B | sessionStart | GROUPBYGAP(#Format!Timestamp;5m) |
| #C | Path | GROUP_PATH_CHANGES(#Format!Filename) |
| #D | From | JSON_ELEMENT(#Path;0) |
| #E | To | JSON_ELEMENT(#Path;1) |
| #F | DwellTimeSecs | DENULLIFY(GROUP_DIFF(#Format!Timestamp))/1000 This function turns nulls to ‘0’s, calculates the difference and turns it from MS to Seconds |
Determining the top page moves
Now that you have click pairs, you can determine what the top page moves are from one page to another with simple grouping and counting; the ClickPairs page is referenced for this analysis.
This sheet is named TopMoves.
| Ref | Column names | Formula |
|---|---|---|
| #A | From | GROUPBY(#ClickPairs!From) |
| #B | To | GROUPBY(#ClickPairs!To) |
| #C | Count | GROUPCOUNT() |
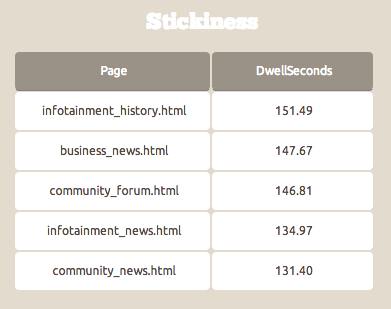
Determining notable dwell time
The time series created in ClickPairs gave valuable information about how long users spend on given pages and where they go from those pages. This sheet gives you insights into the areas that users spend the most time. A filter and sort are applied to determine the top pages.
This sheet is named LongestDwellTime.
| Ref | Column name | Formula |
|---|---|---|
| #A | Page | GROUPBY(#ClickPairs!From) |
| #B | DwellSeconds | GROUPAVERAGE(#ClickPairs!DwellTimeSecs) |
A simple filter is made where Page doesn't equal external.
A sort on the DwellSeconds column is made limiting to the top 10.
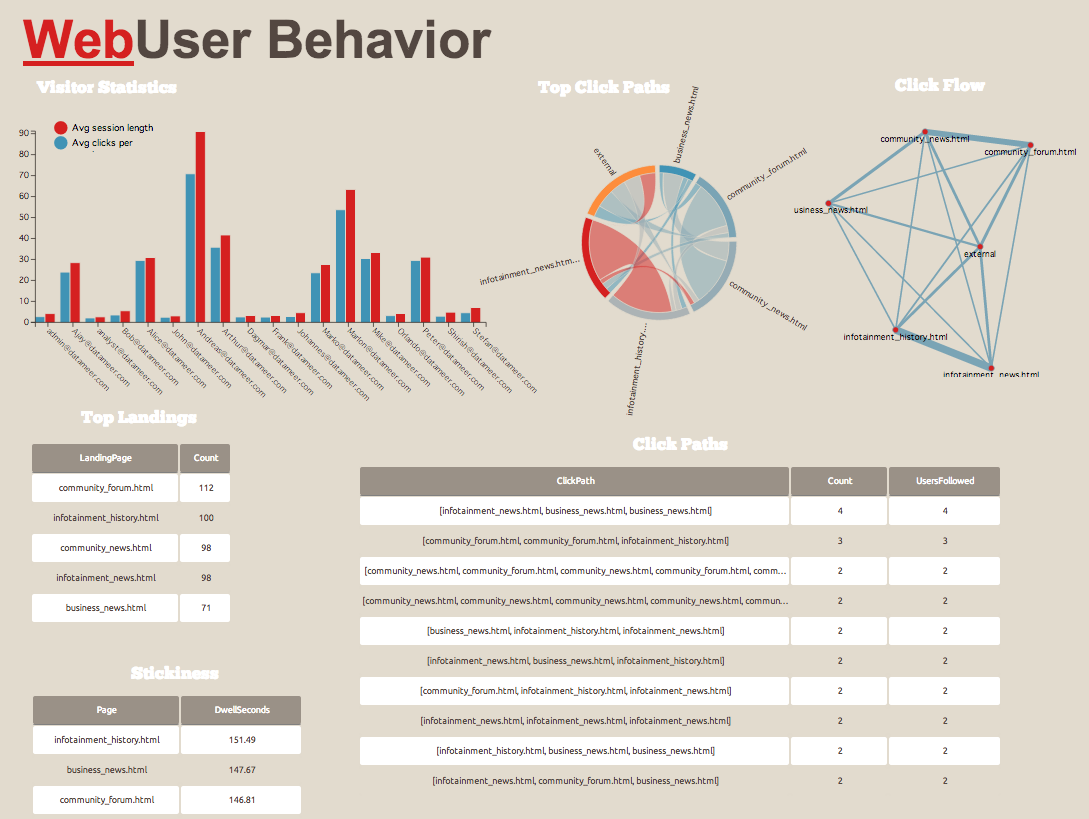
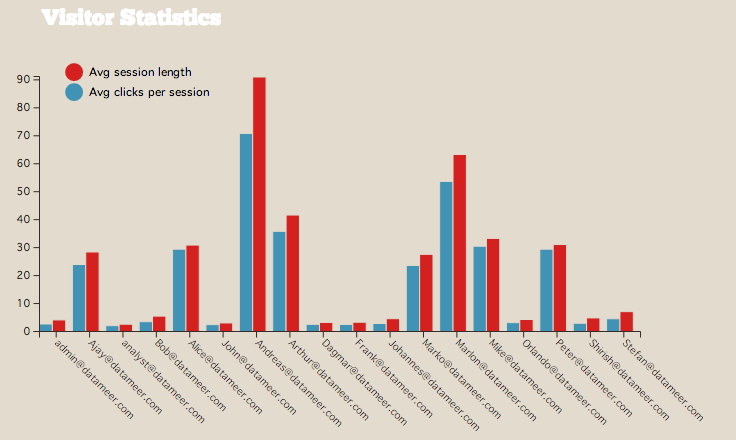
Building the Infographics
Visitor statistics
| Widget type | Sheet | Data1 | Data2 | Label |
|---|---|---|---|---|
| Grouped Bar Chart | Joined | avgClicks | avgMins |
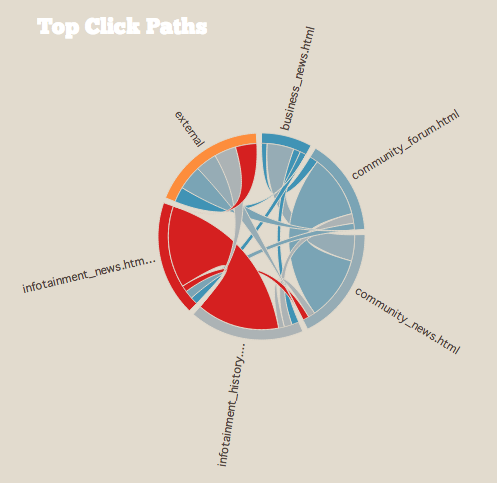
Top click paths
| Widget type | Sheet | Start | End | Weight |
|---|---|---|---|---|
| Circular Network | TopMoves | From | To | Count |
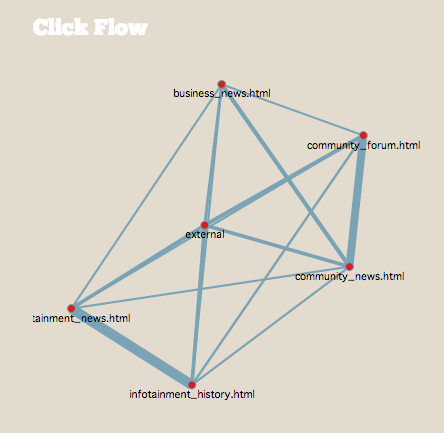
Click flow
| Widget type | Sheet | Source | Target | Strength |
|---|---|---|---|---|
| Network | TopMoves | From | To | Count |
Top landings
| Widget type | Sheet | Data1 | Data2 |
|---|---|---|---|
| Table | TopLandingPage | LandingPage | Count |
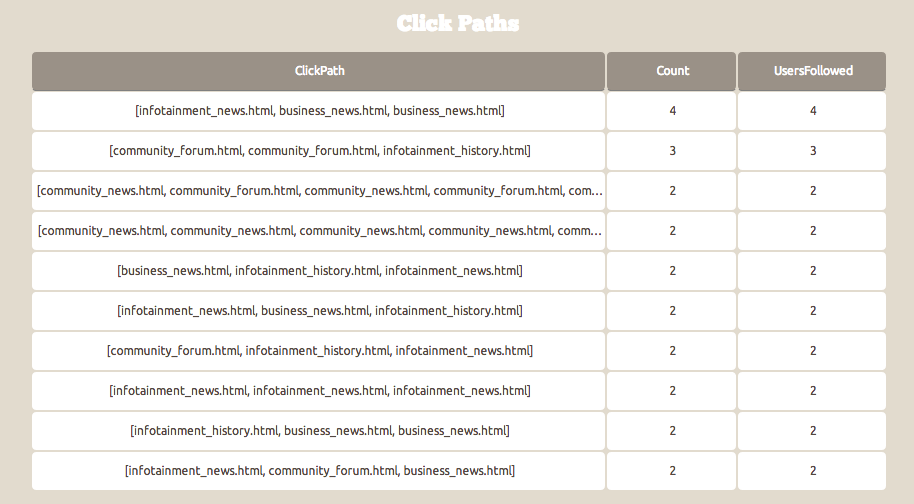
Click paths
| Widget type | ||||
|---|---|---|---|---|
| Table | TopClickPaths | ClickPath | Count | UsersFollowed |
Stickiness
| Widget type | Sheet | Data1 | Data2 |
|---|---|---|---|
| Table | LongestDwellTime | Page | DwellSeconds |