Smart Analytics
Critical in helping you better understand your data, Smart Analytics is a key tool in enabling you to better understand customer segmentation and behavior as well as guide further analysis based on patterns Datameer automatically detects in the data. The new Smart Analytics include four main functionality areas: clustering, decision tree, column dependencies and recommendations. Rather than relying on scarce data scientists, business users can use the simple, point and click functions of Datameer’s Smart Analytics combined with the linear scalability and data flexibility of Hadoop to analyze datasets of any type and size.
Smart Analytic Tools
There are different types of smart analytic tools Datameer offers to empower you to get the most out of their data.
- Descriptive analytics classifies data into more understandable information.
- Clustering - finds similarities in data and creates like groups.
- Decision tree - find where data branches on its way to a target destination.
- Column dependencies - finds how strong one column compares to other columns.
- The recommendation engine analyzes past transaction data to make predictions on future events.
- Recommendations - Inputs users, items, and users ratings of those items. Recommends items to other users based on user ratings.
What types of questions can smart analytics answer?
- Find out who your customers really are.
- Find what type promotion would effect different types of customers.
- Find what types of products should be recommended to which types of customers.
- Find what factors cause problems in your business.
- Detect potential fraud.
Big Data Analytics, Smarter
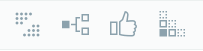
The four smart analytic tools can be found on the toolbar of a workbook.
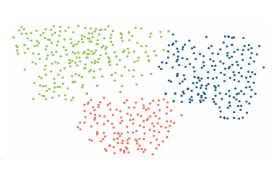
Clustering
Clustering identifies groups (clusters) of records such that records within a cluster are similar to each other and records across clusters are dissimilar to each other. The algorithm used is K-Means, the similarity measure is based on Euclidean distance.
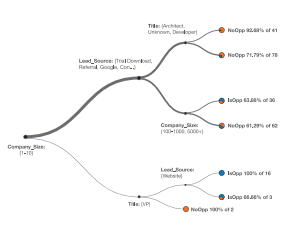
Decision Tree
A decision tree describes how different attributes (columns) in a data set determine the values of another (categorical) column in that data set – the target attribute. The algorithm implemented is Classification And Regression Trees (CART), it grows the tree using the input columns as decision nodes and the target column for the leaf nodes. The tree is pruned to better match the actual structure that is hidden within the data.
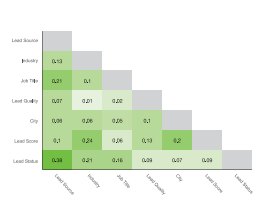
Column Dependencies
Column Dependencies compares pairs of attributes (columns) to determine how strong two columns relate to each other. The computed value is between 0 and 1, it is based on mutual information, Spearman's Correlation, or Perason's Correlation. It measures how much, given the value of one column, the uncertainty about the value of the other column is reduced. A column dependency value equal to 1 means that given the value of one column, one can tell the value of the other column with 100% certainty.
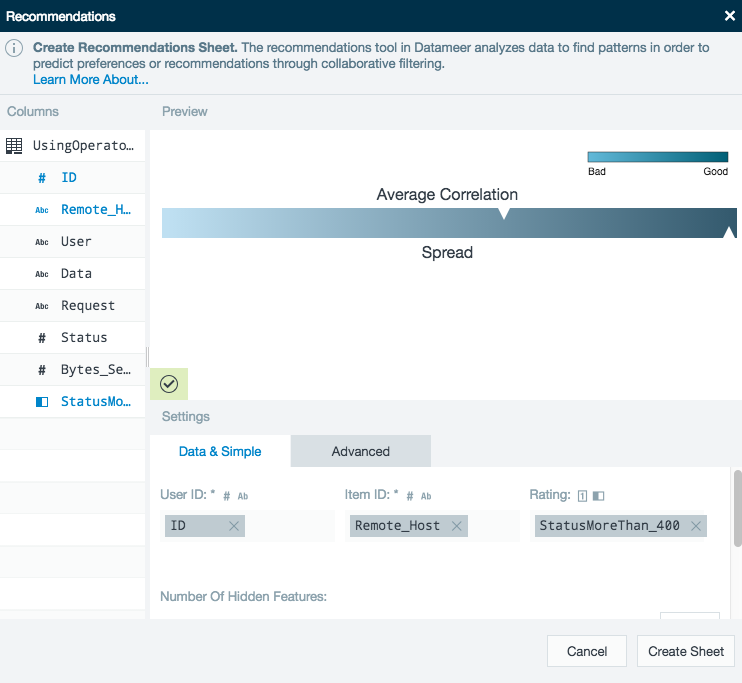
Recommendations
The recommendation engine takes transaction data of the form <userID, itemID, rating> as input. It applies a matrix factorization on that data to learn the (hidden) features of every single user and item. These features (technically vectors of float values) are then used to compute the actual recommendation scores, by computing the dot product between a user-item (feature vector-) pair.