Network Intrusion Detection
The Network Intrusion Detection takes tcpdump data to show you how you can configure Datameer to monitor network attacks. This application targets three different types of network attacks: pod attacks, Ipsweep attacks, and Neptune attacks.
Infographic
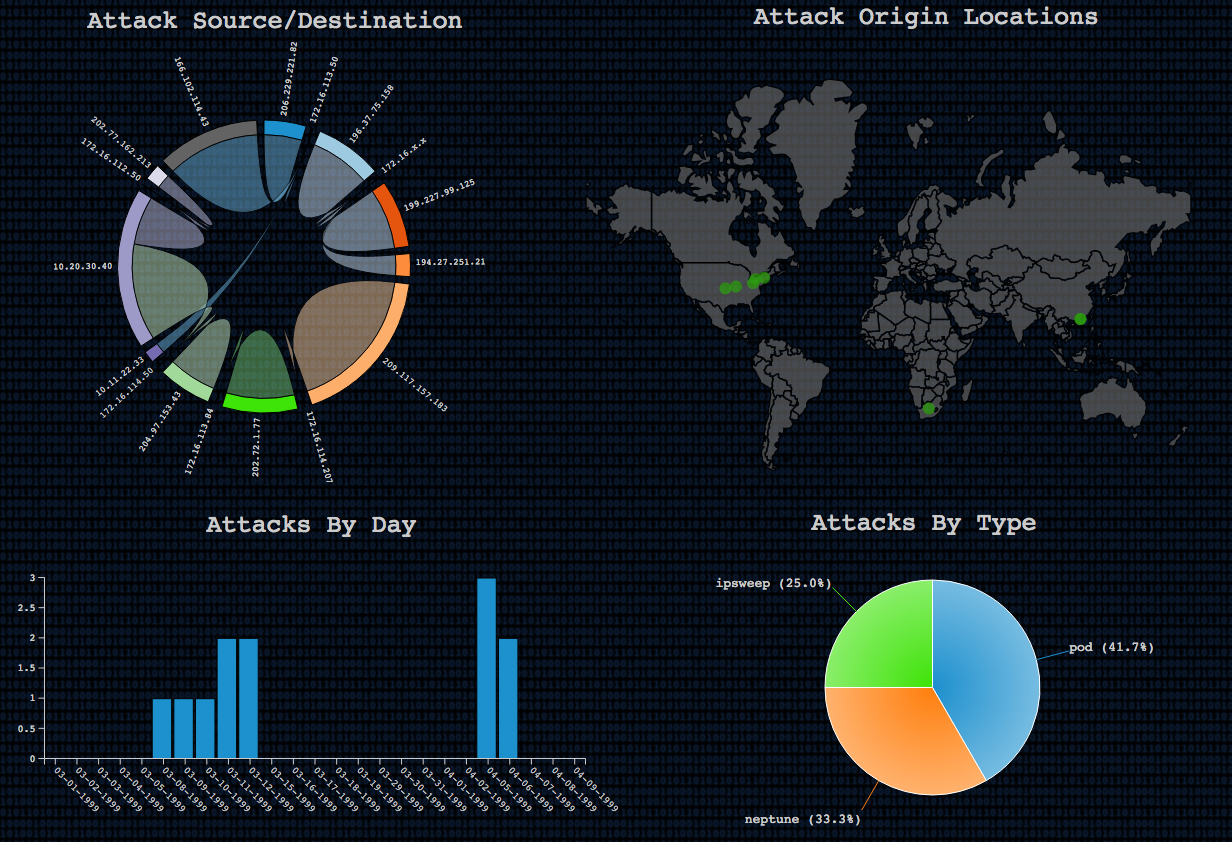
This infographic uses four widgets to show the types of attack, when they occur, their source, and their origins:
- The Attack Source/Destination circular network widget shows relationship between the source and destination. The more hits shared between them, the larger the relationship.
- The Attack Origin Locations map shows from where in the world the attacks are originating.
- The Attacks By Day bar chart displays how many the attacks on specific days.
- The Attacks By Type pie chart illustrates how many of the attacks were of each of the three types: pod attacks, Ipsweep attacks, and Neptune attacks.
File Uploads
The GeoLiteCityBlocksFileUpload and GeoLiteCityLocationsFileUpload provide the data to populate the map widget. The TcpDumpFileUpload provides the data about the attacks from the tcpdump.
Workbooks
This application uses the following workbooks to perform calculations and create the infographic:
- The IntrusionDetectionWorkbook calculates the information from tcpdump file upload. The all_attacks_sort sheet contains the sorted information about the different sources of attacks, used in the Attack Source/Destination widget. The day_totals sheet sorts the attacks by date and counts them to create the Attacks By Day widget. Finally, the attacks_by_type sheet groups the attacks into type and then counts the total to make the Attacks By Type widget.
- The SourceGeoLocationWorkook provides data to create the map widget. It combines the IP locations and geographic information to map the different IP origin locations.