Flight Delays
This app computes flight delays for domestic flights inside the United States, such as the average delay by carrier or the average delay by airport. Data is originally from public data sources.
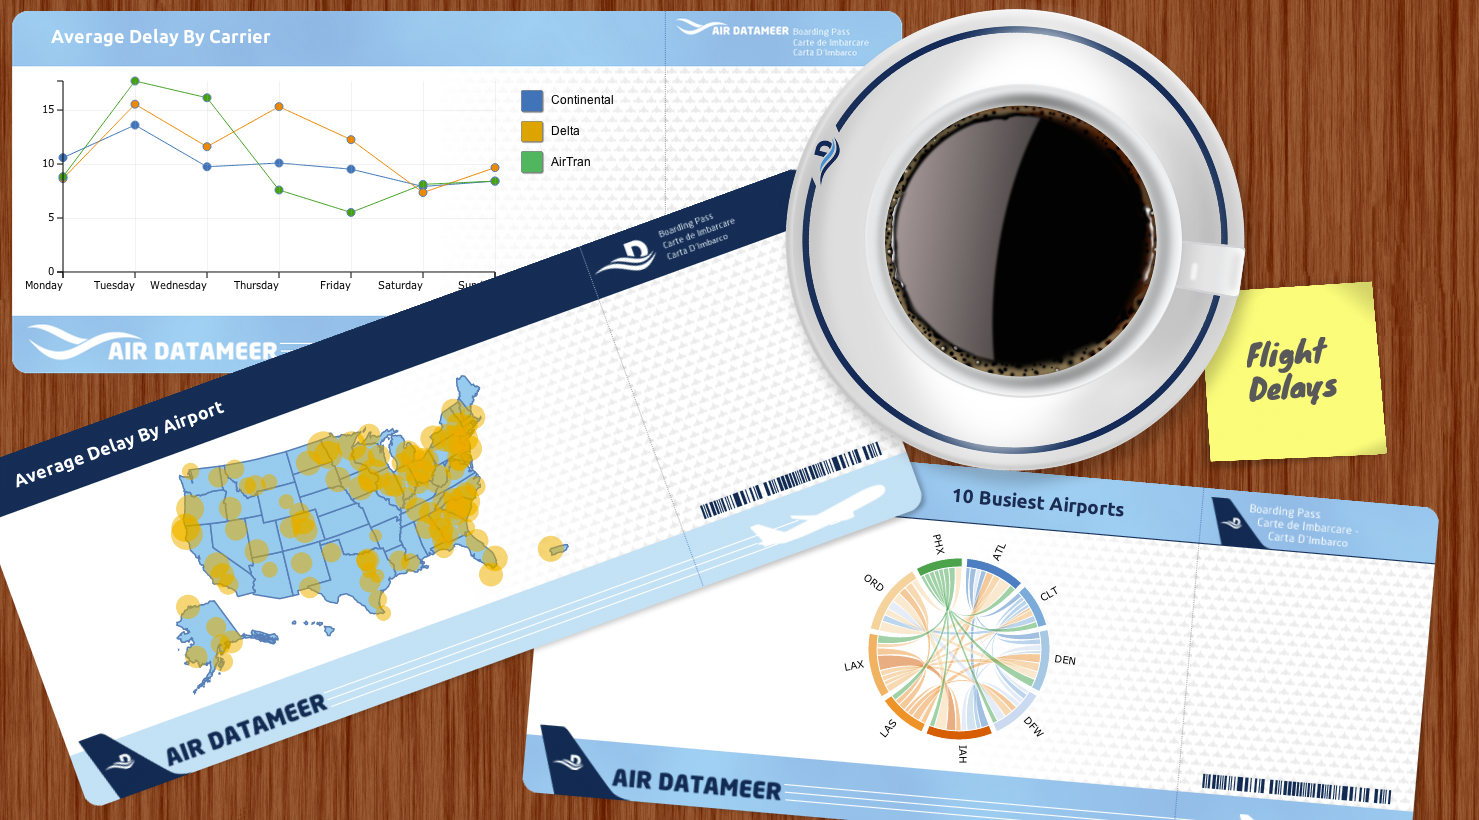
Infographics
The infographic shows:
- The average delay by weekday per carrier.
- The average delay by airport (independent of the carrier).
- The average delays between the 10 busiest airports in the US.
Connection and Import
1) The Flight delay date is provided by the Bureau of Transportation Statistics. We made this data set available on a Amazon S3 instance. When this import job is triggered, it pulls the data from there.
2) We also put a publicly available dataset (OpenFlights.org) that contains longitude and latitude values of airports on S3. This is needed by the map widget in order to plot the bubbles that visualize the average delay exactly on the locations where the airports are.
3) Another small input data set is a mapping of weekday numbers to weekday names.
Workbook
The workbook does all the necessary steps to compute:
- The average delays per carrier per day of the week. This is done for the three example carriers Continental, Delta and AirTran. Edit the corresponding filter in the workbook if you want to compute it for different carriers.
- The average delays for all major US airports.
- The average delays between the 10 busiest airports in the US.
Only departure delays are computed. You can edit the workbook in order to compute arrival delays.To do so, look for DepDelayMinutes in the formulas and replace it with ArrDelayMinutes.
It contains all flights and their delays from major US airports from January 2011.