Failed US Banks
The Failed US Banks application highlights bank failures across the United States over the past decade.
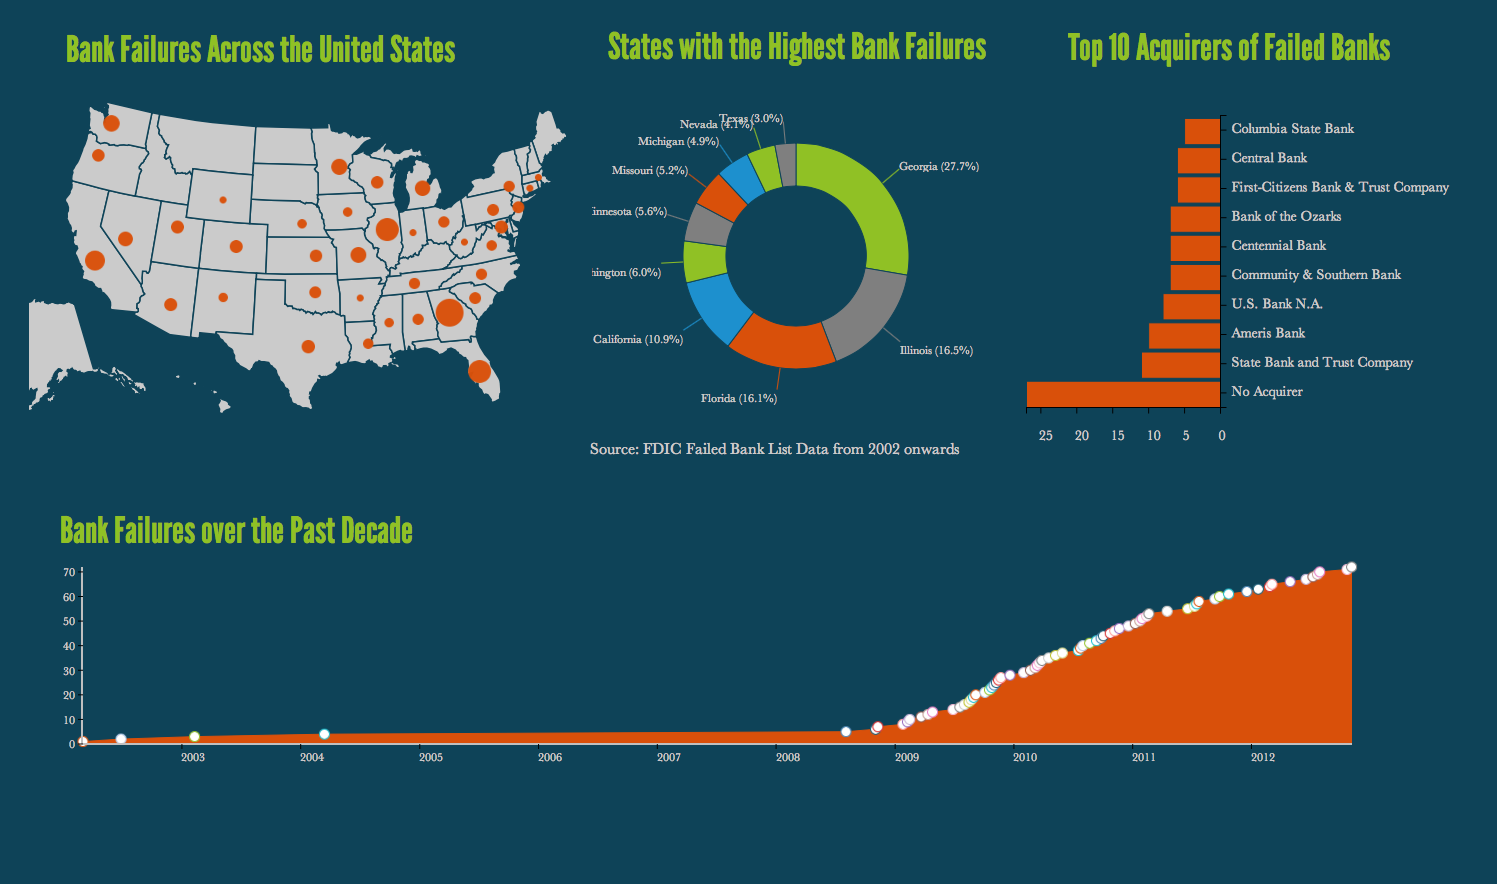
Infographic
The application displays the states with the highest bank failures and top acquirers of failed banks with the following widgets using time series and geospatial data:
The Bank Failures Across the United States map counts the number of failed banks at state-level aggregation and joins that number with geospatial data to show locations.
The States with the Highest Bank Failures chart compares the top 10 states according to the number of failed banks in that state.
The Top 10 Acquirers of Failed Banks graph identifies the top 10 acquirers of failed banks in the US.
The Bank Failures over the Past Decade graph illustrates the number of failed banks over time.
File Uploads
The infographics and workbooks utilize the following file uploads:
- Failed Bank List
- State Acronyms
- US States Long Lat
Workbooks
The Failed Bank List workbook combines data from the Fail Bank List, State Acronyms, and US States Long Lat file uploads to find the number of failed banks at the state-level and to identify major acquirers of those banks. The analysis is limited to the 10 top states and the 10 top acquirers of failed banks sorted in descending order. The Failed_Banks sheet shows the relationship between the number of failed banks and their closing date in a time series chart.