Decision Tree
What is a Decision Tree?
Decision trees helps you understand the different combinations of data attributes that result in a desired outcome. Decision trees are often used when enriching a dataset with additional data sources to optimize a process for a better outcome. The structure of the decision tree reflects the structure that is possibly hidden in data and is analyzed based on the Classification And Regression Tree (CART) method introduced by Breiman, and overfitting is handled through pruning.
Decision tree example
Open a workbook to the worksheet you would like to analyze with Datameer's smart analytic decision tree tool.
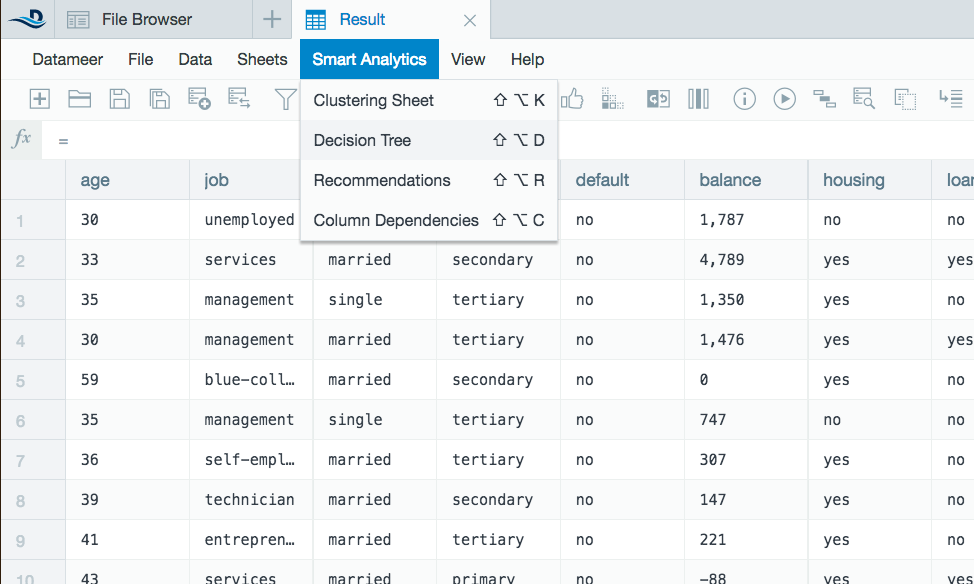
- Select Smart Analytics from the top and then select Decision Tree from the drop down menu or click the Decision Tree icon on the tool bar.
- A decision tree wizard opens. Drag and drop the column names to the Included Columns field. Drag and and drop another column into the Target field as a constant.
- In this example, you are testing how the data from the bank determines characteristics of who purchased products.
- See Advanced Settings to further analyze the decision tree.
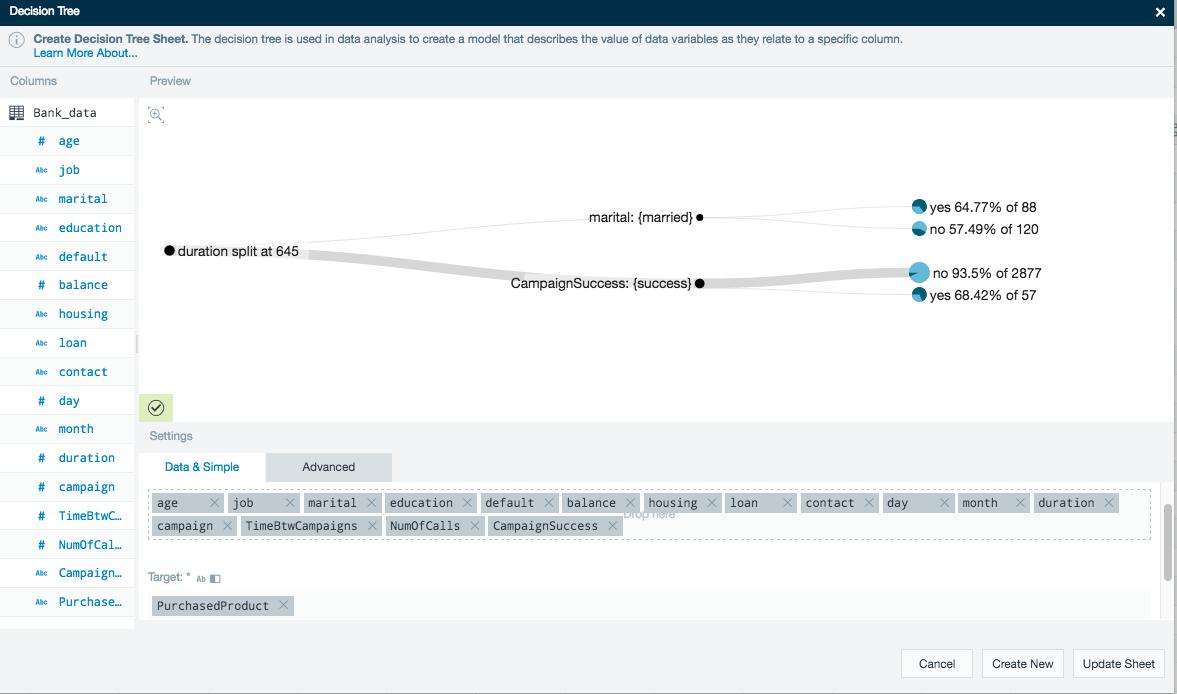
- The decision tree finds the optimal analysis in the data and branch the data visually.
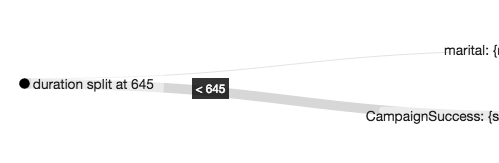
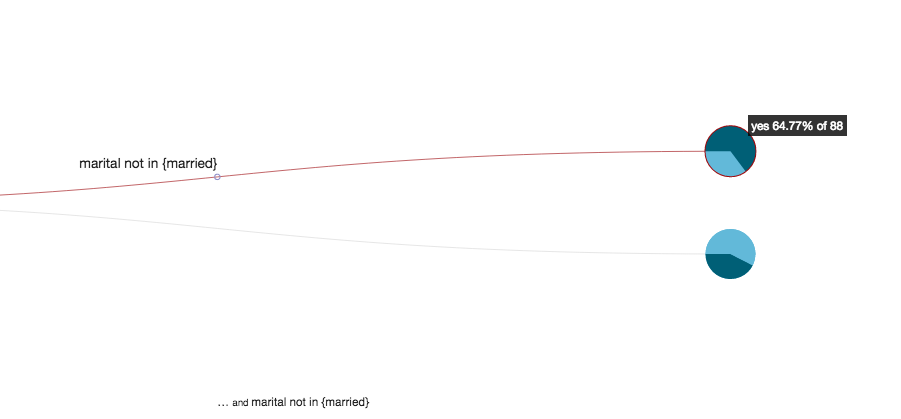
- In this example the branch shows a distinction between campaign durations that lasted under or over 645 days. Campaigns that are larger than this time period are statistically more likely to be successful.
- When continuing along the decision tree you can see further details of the data.
- Continuing with this example, customers that aren't married are more likely of purchasing products than those that are married.
- Click Create Sheet when finished to bring your decision data into a new worksheet.
- A new decision tree worksheet will be added to the workbook with the data from the columns analyzed showing how the decision tree classified the input data with respect to the target column.
Advanced decision tree settings
Use these advanced settings to further enhance the decision tree.
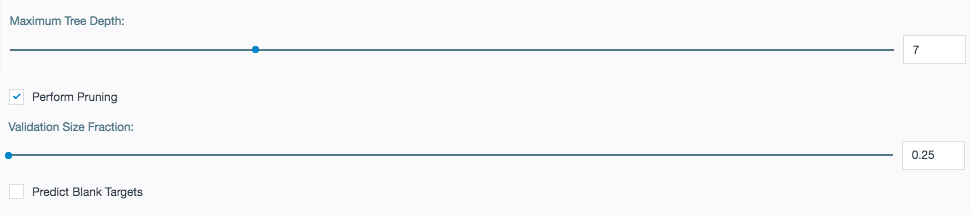
Maximum Tree Depth: Set the maximum number of branches for the algorithm to create. There are usually less levels if the pruning option is checked.
Preforming Pruning: Reduces the size of the decision tree to better reflect the important patterns in the data. Smaller branches are grouped together with similar branches to filter out noise in the tree. Pruning stops when accuracy on the validation set decreases.
Validation Size Fraction: Part of your data is used exclusively for pruning the decision tree. Here you can set the percentage of your data to be used for pruning up to 50%.
Use caution when setting the validation size fraction. Larger data sets (example: over 10,000 rows) can handle larger amounts of pruning while a large fraction of pruning on smaller data sets might not fully represent your data as not enough data is being used to build the tree itself.
Predict Blank Targets: The decision tree is trained on non-blank value records of the selected target column. The decision tree is then then applied to records with blank target columns. The resulting sheet contains the records where the target column was blank, the prediction that came from the trained decision tree, and a confidence value of the prediction.
Decision tree Flip Side Analytics
Use the Flip Side feature of a decision tree sheet to view a full screen version of the decision tree to easily navigate and view where decisions have been made.
The text above the sheet names displays the decision path for the pie chart where the mouse is hovering. Help text is shown where the mouse hovers to view the resulting data.