Column Dependencies
What are Column Dependencies?
Column dependencies analyze data by comparing selected columns with each other. A value is assigned in each record comparing how strongly the different columns relate.
Want to know how strongly a single data attribute like age, location, or gender, relates to other data attributes like income, college degree, or credit score? The column dependency algorithm automatically compares every possible data attribute combination and visually ranks the strength of those relationships so you can instantly see where to focus further. Those relationships are important themselves and are often used to help target further analysis.
Column dependencies example
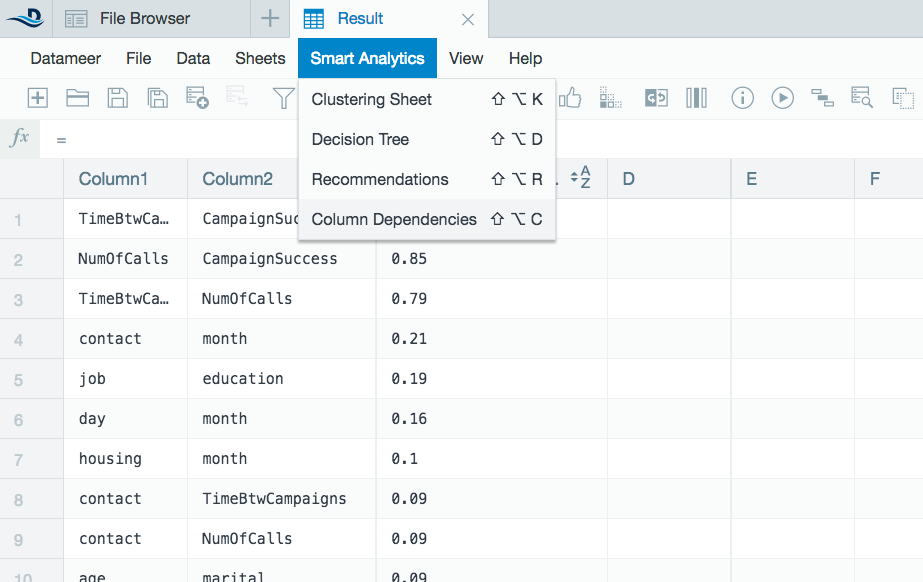
Open a workbook to the worksheet you would like to analyze with Datameer's smart analytic column dependencies tool.
- Select Smart Analytics from the top and then select Column Dependencies from the drop down menu or click the Column Dependencies icon on the tool bar.
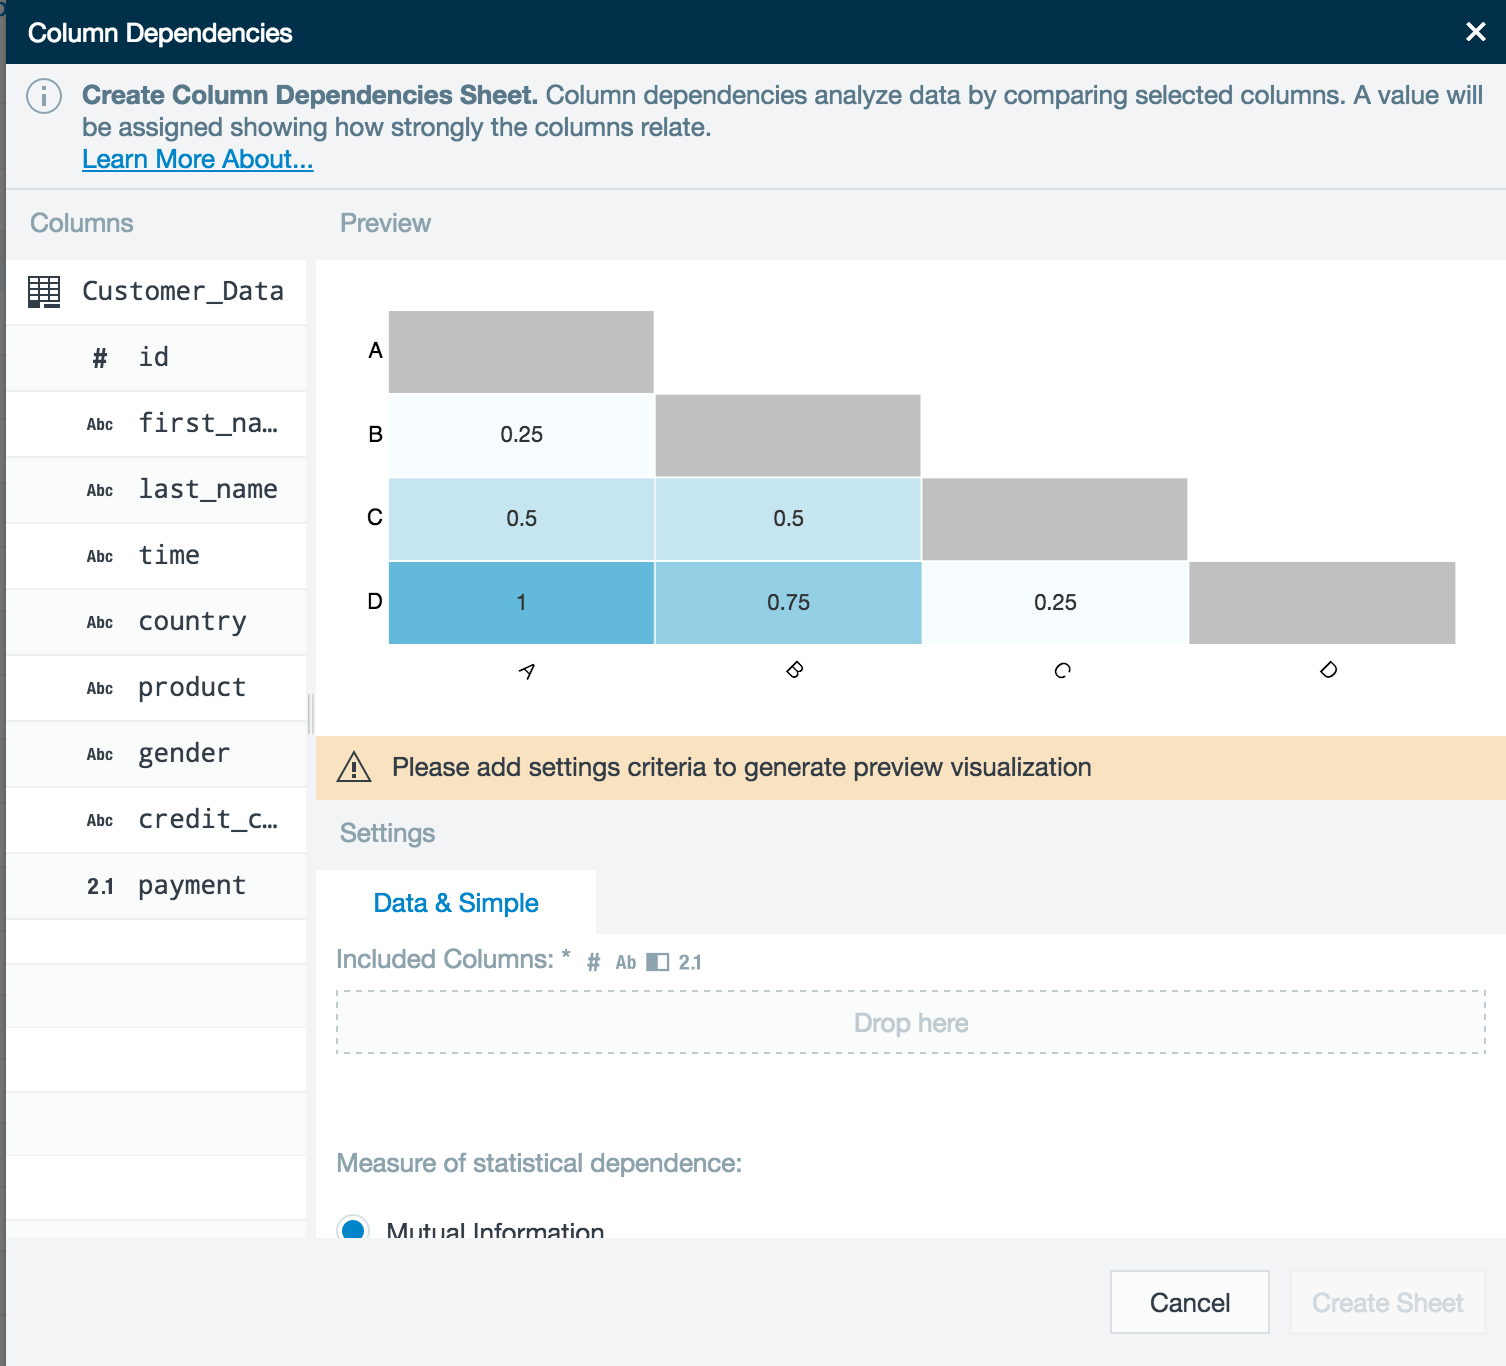
- A column dependencies wizard pops up. Drag and drop the column names on the left into the Included Columns field under the Data and Simple tab.
- Select which correlation you want to use. Select from either mutual information, Pearson's Correlation, or Spearman's Correlation to measure how much one variable tells us about another. The Pearson's and Spearman's correlations only accept integer and float values.
- In this example, four columns are being compared. The strongest dependency is between the income and age column.
- Click Create Sheet when finished to bring your column dependency data into a new worksheet.
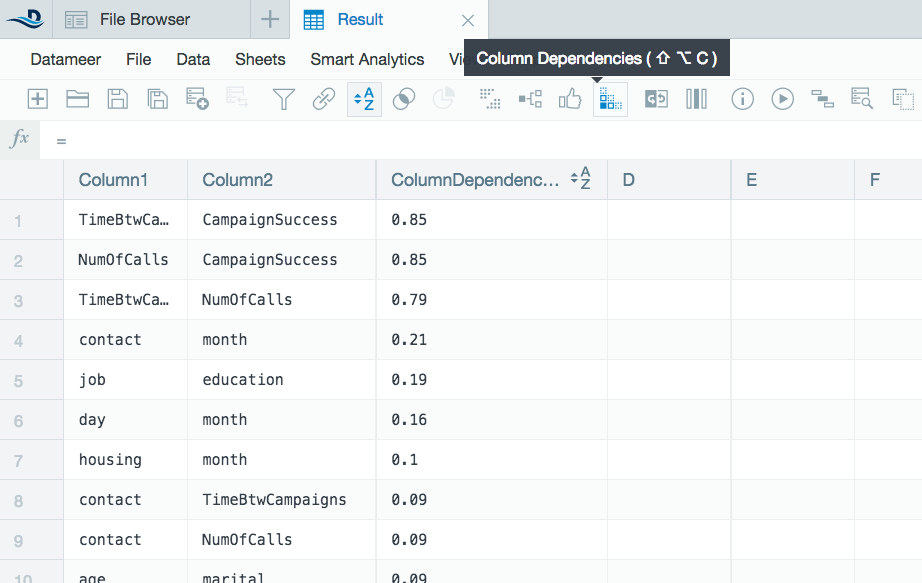
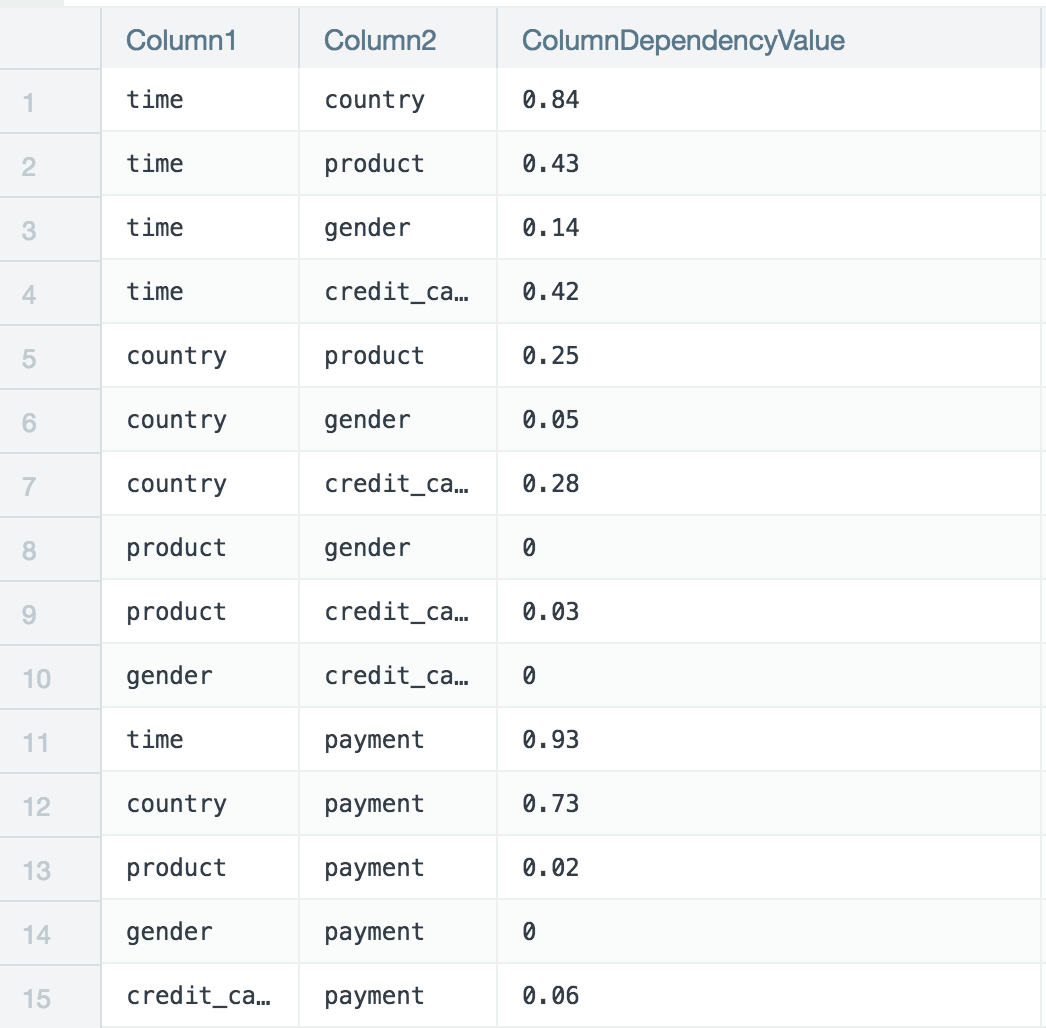
- A new column dependency worksheet is added to the workbook with the data from the columns analyzed as well as a column showing the different column dependency values (ColumnDependencyValues). If you used Spearman's or Pearson's correlation, there is an additional column with the p-value which shows how significant the result is based on the number of samples and the correlation value. A p-value close to zero is more significant; a value close to one is not significant. If you use only two values, a p-value can't be calculated and a p-value of null appears.
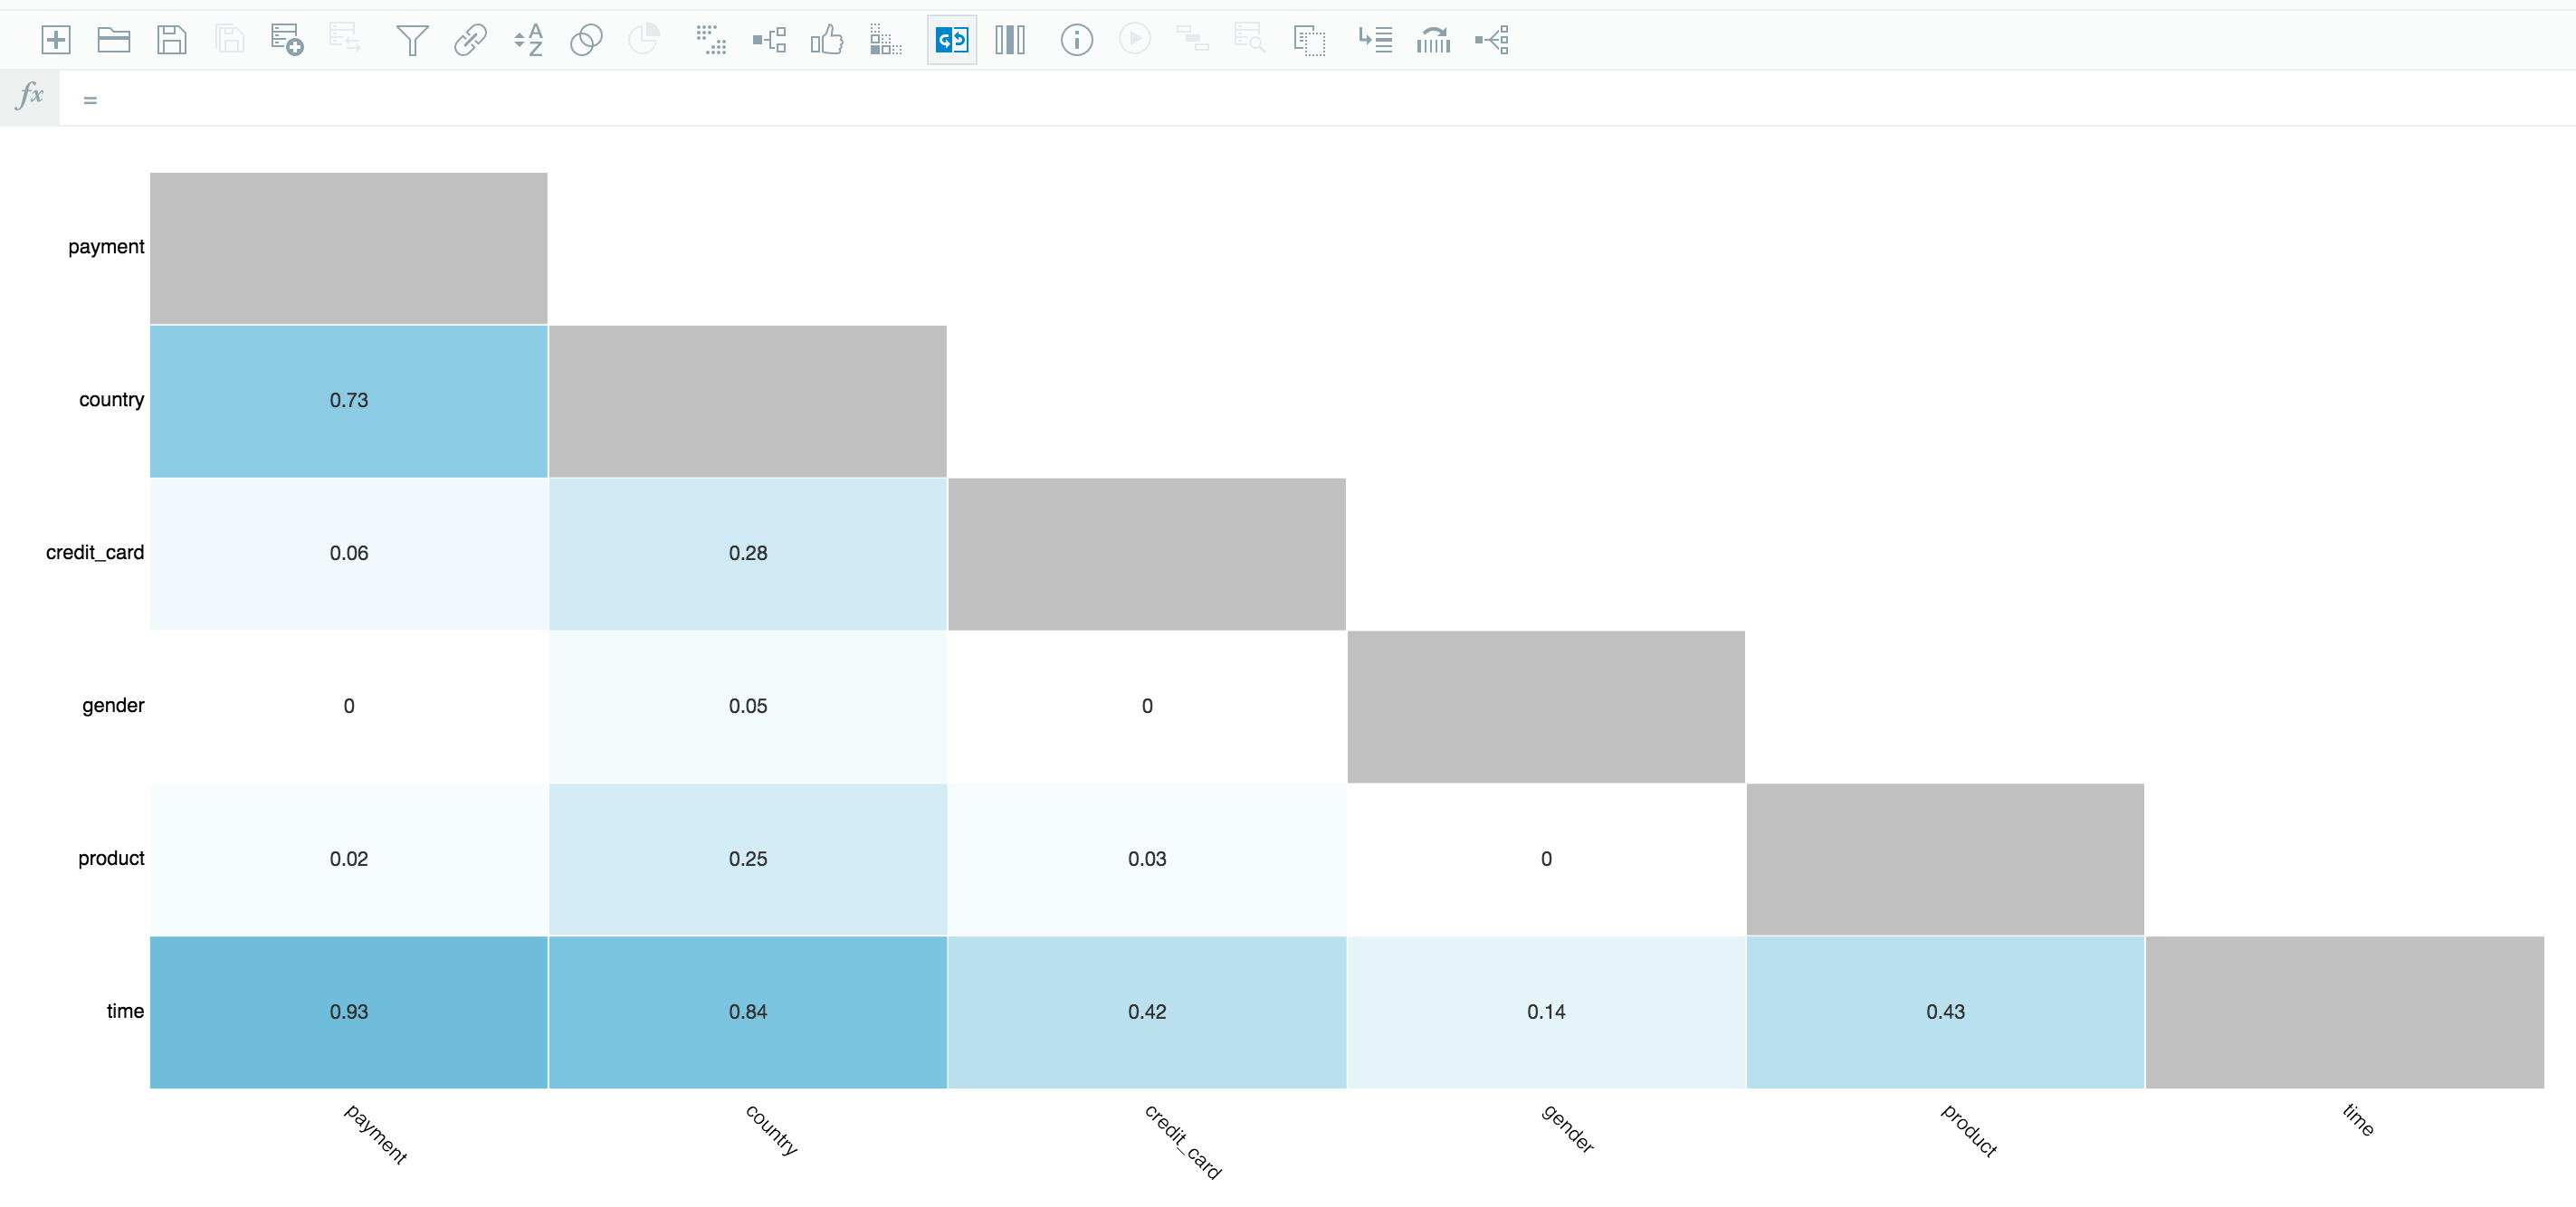
- Each column will be shown with the columns with which they have been compared. A value has been assigned to the pair of columns to show how strongly they are dependent on each other.
- You can then use this new dependency data to better analyze data.
Column dependencies Flip Side analytics
Use the Flip Side feature to view a full screen version of the Column Dependencies chart to easily visualize the strength between the each column.