Clustering
What is Clustering?
Clustering with Datameer uses a K-means algorithm to automatically find non-obvious but related groups within data by automating the process of identifying and measuring similarities within the dataset. The benefit is that it can segment data into groups and you can treat those groups differently.
Clustering example
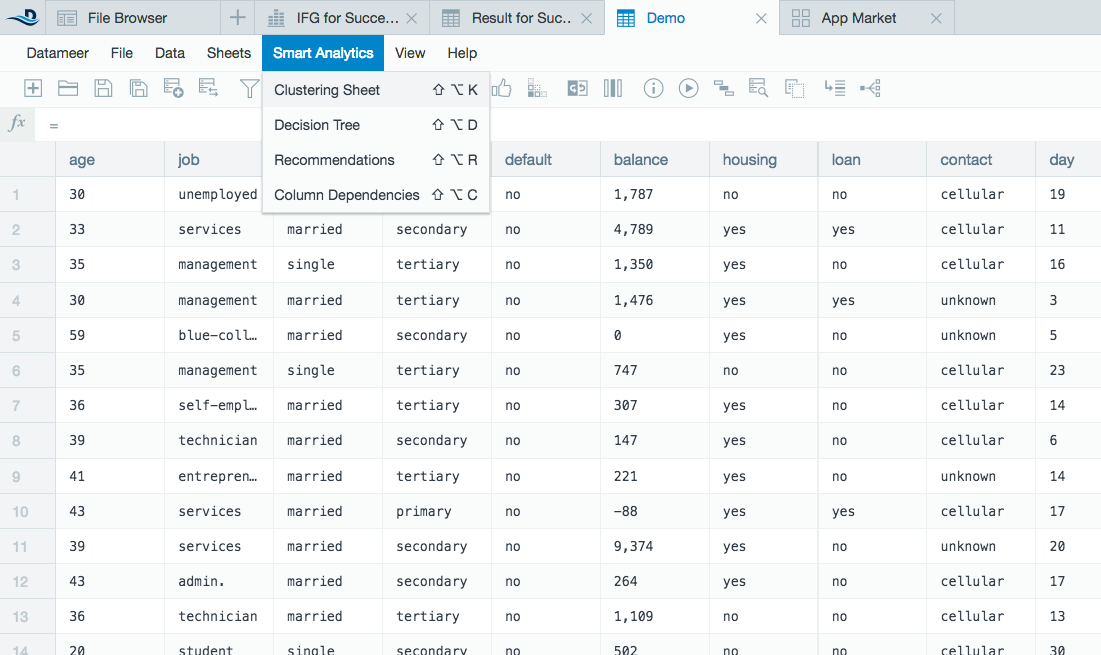
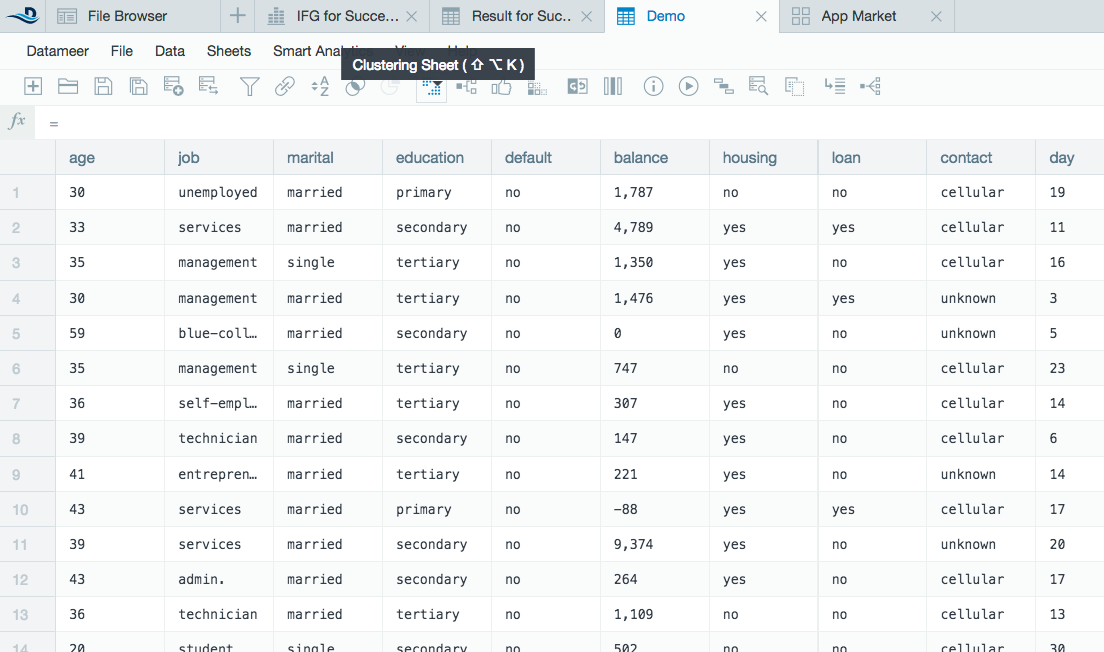
Open a workbook to the worksheet you want to analyze with Datameer's smart analytic clustering tool.
Select Smart Analytics from the top and then select Clustering from the drop down menu or click the Clustering icon on the tool bar.
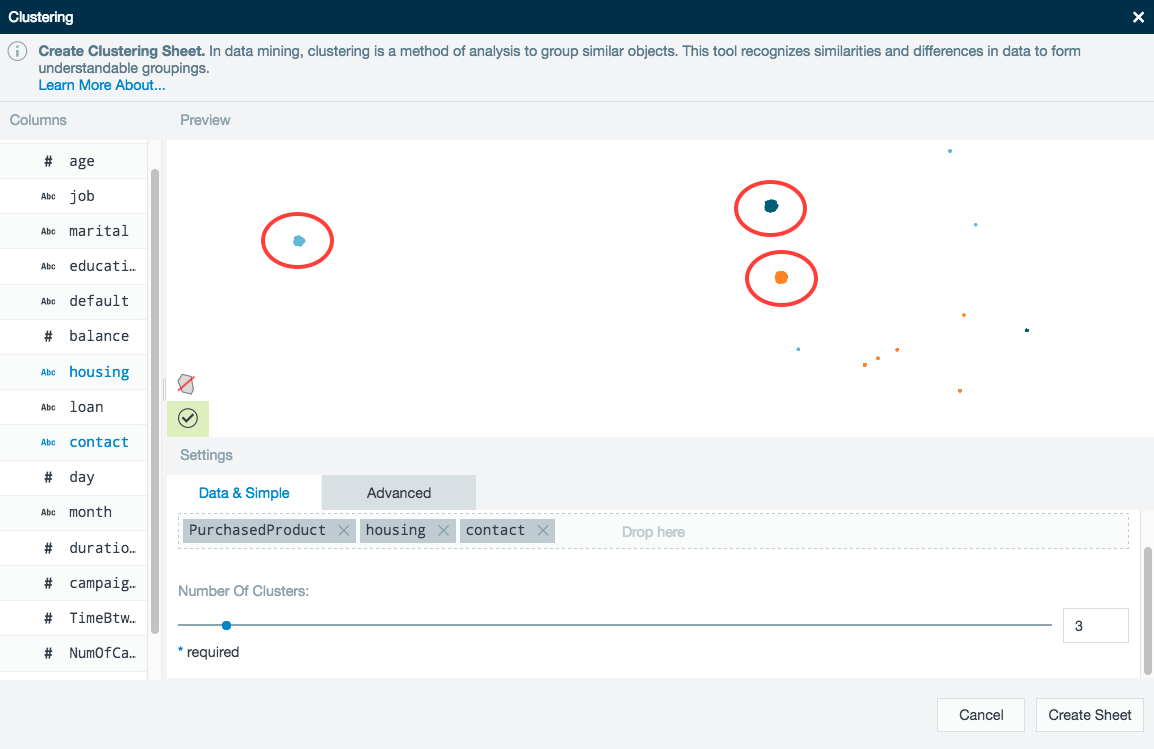
A clustering wizard appears. Drag-and-drop the column names on the left into the Included Columns field under the Data and Simple tab.
K-means and STRING Columns
For STRING columns, Datameer uses indicator values to represent the column using K-means. The number of indicator values is a setting that can be changed in the Advanced tab. For more information, see Advanced cluster settings.
Use the scroll bar to adjust the number of clusters for Datameer to find. In this example, three distinct clusters have been found. See Advanced Settings.
- If the number of clusters in the settings is higher than the number of clusters found, a message notes the number of empty clusters.

- If the number of clusters in the settings is higher than the number of clusters found, a message notes the number of empty clusters.
- Click Create Sheet when finished to bring your clustered data into a new worksheet.
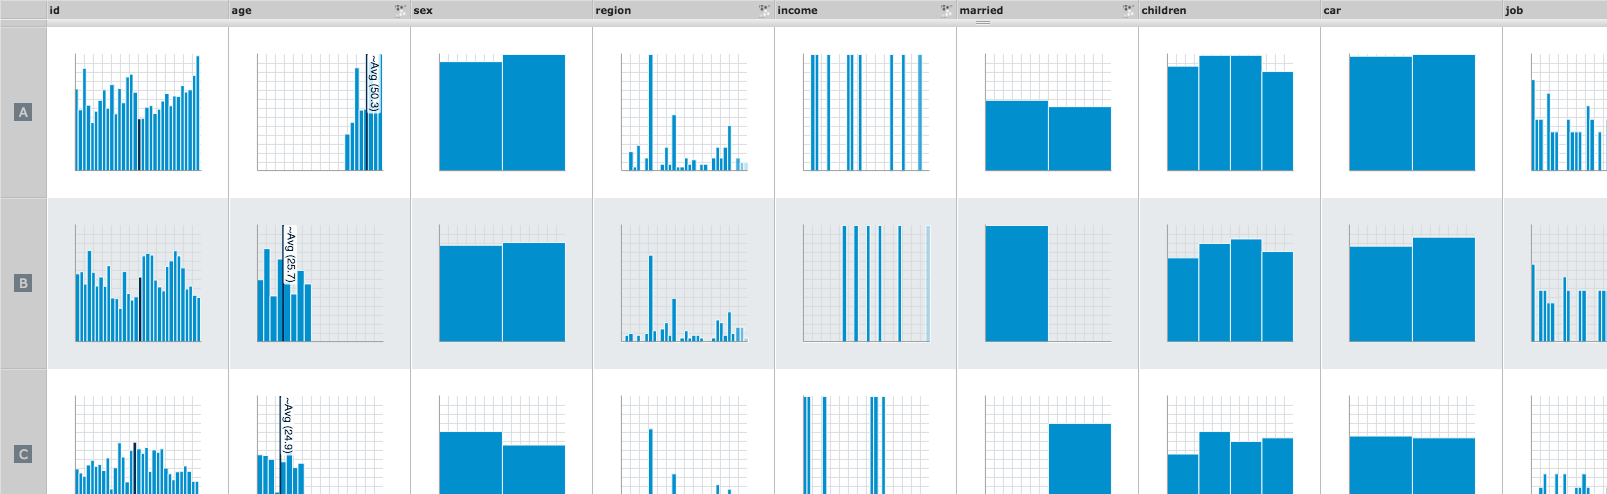
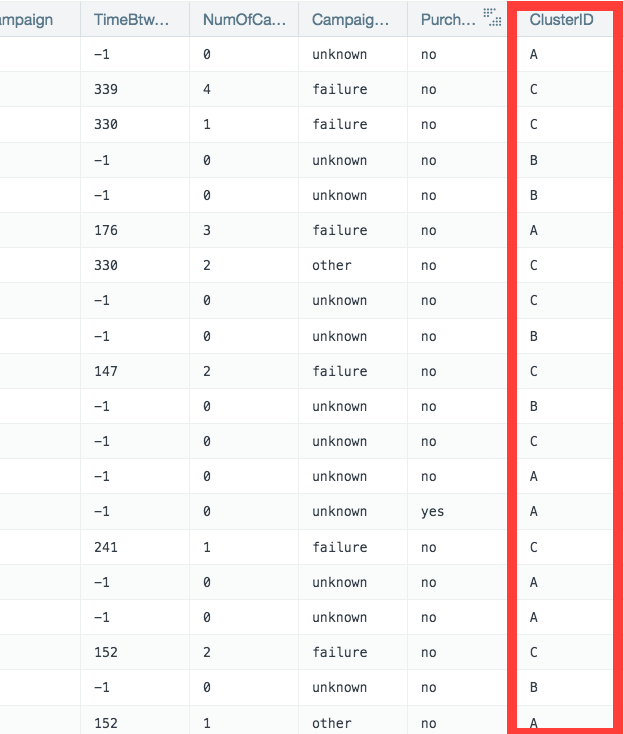
- A new clustered worksheet is added to the workbook with the data from the columns analyzed as well as a column showing the different clusters (ClusterID).
- As three clusters were found in this example, the clusters are separated into A through C.
- You can then use this new clustering data to analyze their data further.
Advanced cluster settings
Use these advanced settings to further enhance clustering data.
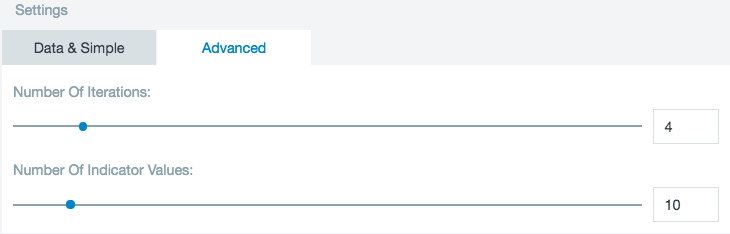
Number of Iterations: The maximum number of iterations the k-means algorithm performs. The more iterations preformed increases the chance of finding an optimal clustering but also increase calculating time. Usually the algorithm converges after a few iterations. In that case it stops the procedure and does not run any further unnecessary iterations.
Number of Indicator Values: K-means only works on numeric data. For categorical data (string columns) indicator columns are created internally (using the values 0 or 1). One indicator column is created per possible value of the categorical data, but the Number of Indicator Values sets the maximum number of columns. Using these values, a clustering can be performed and has a direct correlation to the values of the original column. To make sure you are using the right amount of indication values, examine the cardinality of the columns you want to use. If you have a cardinality below 100 you can adjust the setting to match your Included Column cardinality.
Normalize Numerical Columns: Select this box to subtract the mean and divide by the standard deviation from each record of the different clusters. Since K-means uses Euclidian distance as similarity measure, this is necessary to prevent one column's values from dominating another. This happens internally - the result sheet shows the original values un-normalized.
Clustering Flip Side analytics
Use the Flip Side feature to view histograms depicting how your data is split amongst clusters. Each column in the worksheet that is used to define the clusters is marked with a clustering icon. This feature allows for a quick understanding of how the data is spread across each cluster.