Basic Tutorial
Basic Tutorial: Web Traffic Analysis
This tutorial guides you through building a complete analytics use case that analyzes web traffic for a segment of known customers. The example uses raw web logs and customer records with profile information (typically stored in a database, but simulated here with a CSV file for demonstration purposes). This tutorial highlights many of the major capabilities of Datameer workbooks (including joins, filters, sorting and using the formula builder) and also covers creating an infographic to visualize your analytics results.
With a few simple steps, you can enrich raw web logs (clickstream data) with customer profile data to find the top known web visitors by pageviews (impressions) and traffic. This subset of existing customers who visit your site often is a high-value segment worth targeting in an advertising campaign. This example focuses on creating the workbook and visualizing the results, and uses data sets that have already been uploaded into the system (see below for details).
What you need (provided):
- An Apache web log file
- A table of known customers
What is demonstrated:
- Correlating semi-structured and structured data with a join
- Aggregating and summarizing data with multiple dimensions
- Using the formula builder
- Building your own formulas
- Filtering data
- Sorting data
- Building a basic infographic to communicate your results
Before you start...
This tutorial is packaged as an analytics app called "Tutorial Basic" in the Analytics AppMarket

Before you start, install this app from the App Market tab.
Step-By-Step Guide:
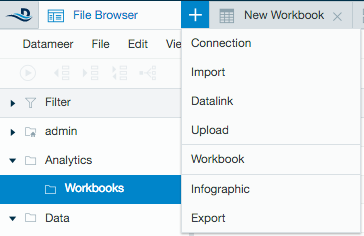
To create your workbook
- Create a new workbook by clicking the + (plus) button and selecting Workbook.
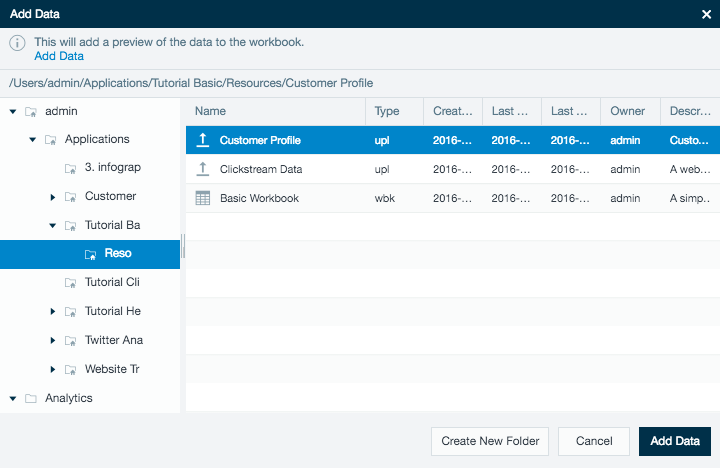
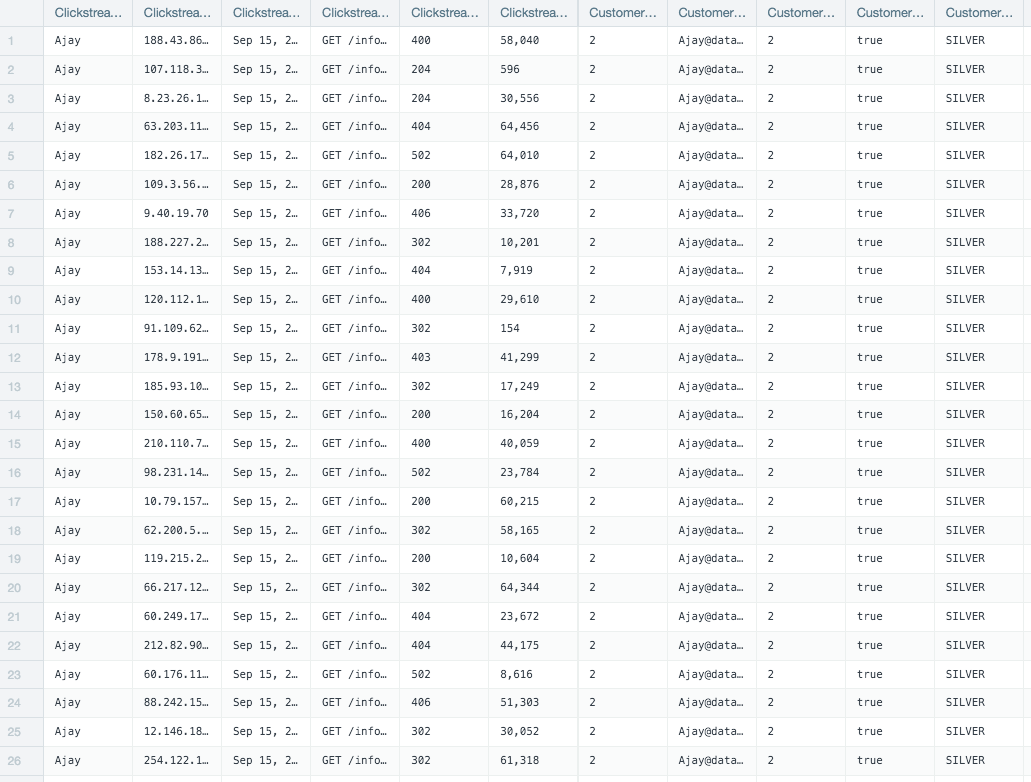
- Select the Tutorial Basic folder from the file tree and select the Apache log file labeled Clickstream Data, then click Add Data.
- From the File menu, choose Add Data and select the users file labeled Customer Profile.
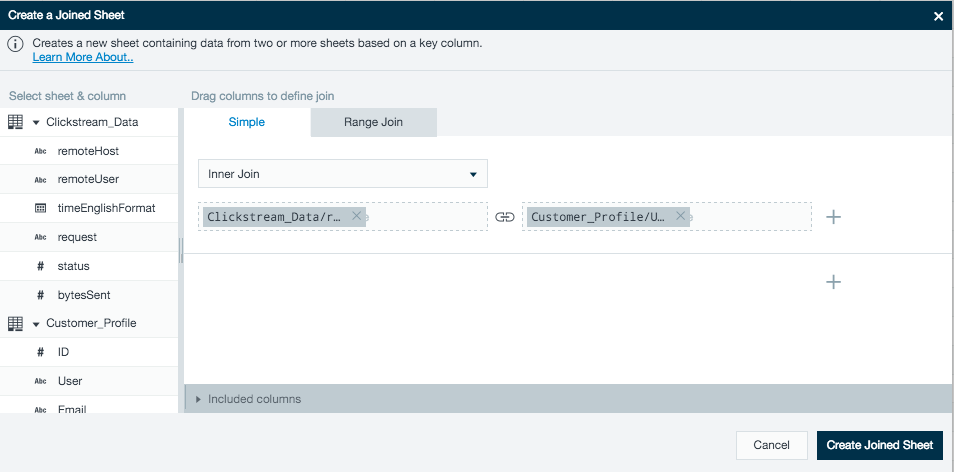
- From the Data menu, select Join. Select the join type as Inner Join. Name the first sheet Clickstream Data, and the second one Customer Profile .
- Select the columns to join. In the example, select remoteUser from the Clickstream Data and user from the Customer Profile.
- Select which columns you want to keep in the final sheet. The selections you make are based on the fields you want to use.
- Click Create Joined Sheet.
Narrow down the data you are viewing
- Click the + (new sheet) tab at the bottom of the workbook to create a new sheet.
- Right-click the new sheet tab and name it Requests. All the GROUP functions operate on this sheet.
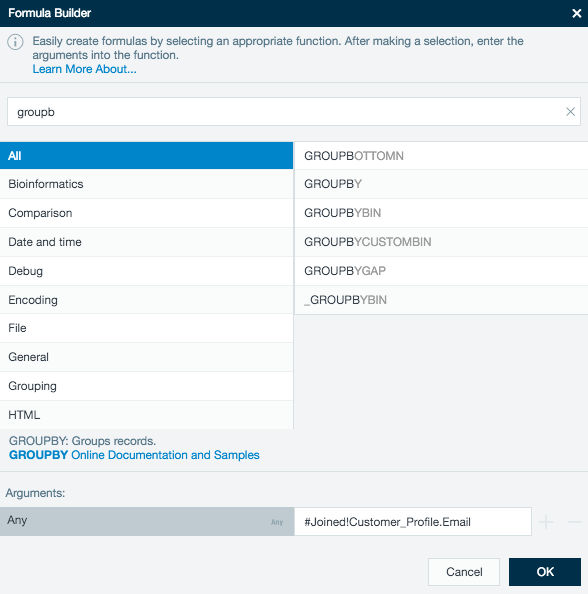
- Group by email address and group by status code. Click the Fx button on the formula line to display the formula builder and set up a formula of GROUPBY() email address. (As of Datameer 7.2, the formula builder is located in the worksheet inspector.)
- Select the function GROUPBY and then click in the Email column from your joined sheet.
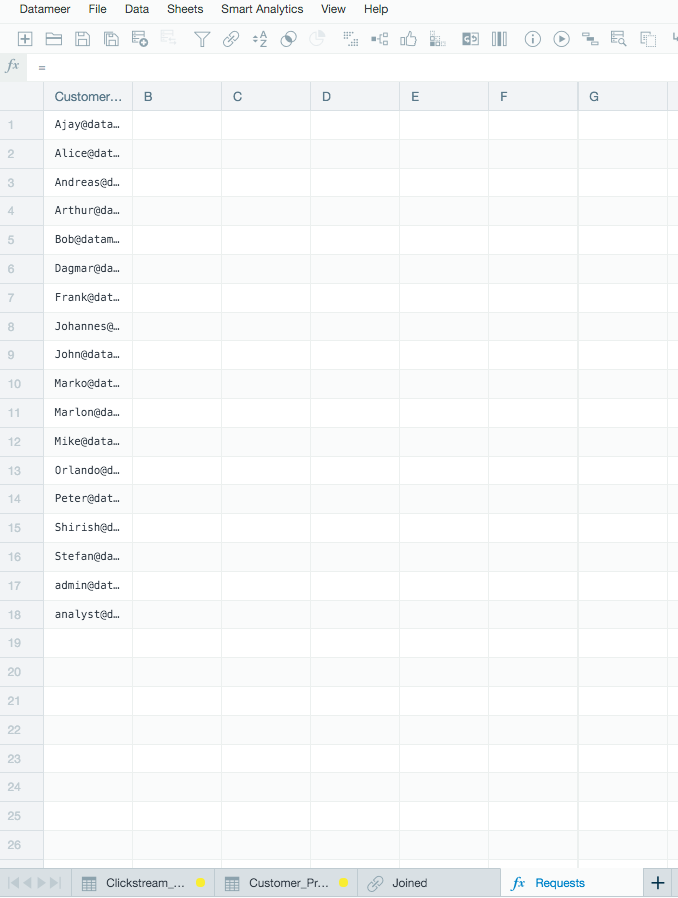
- On the Requests sheet, the data is grouped by email addresses.
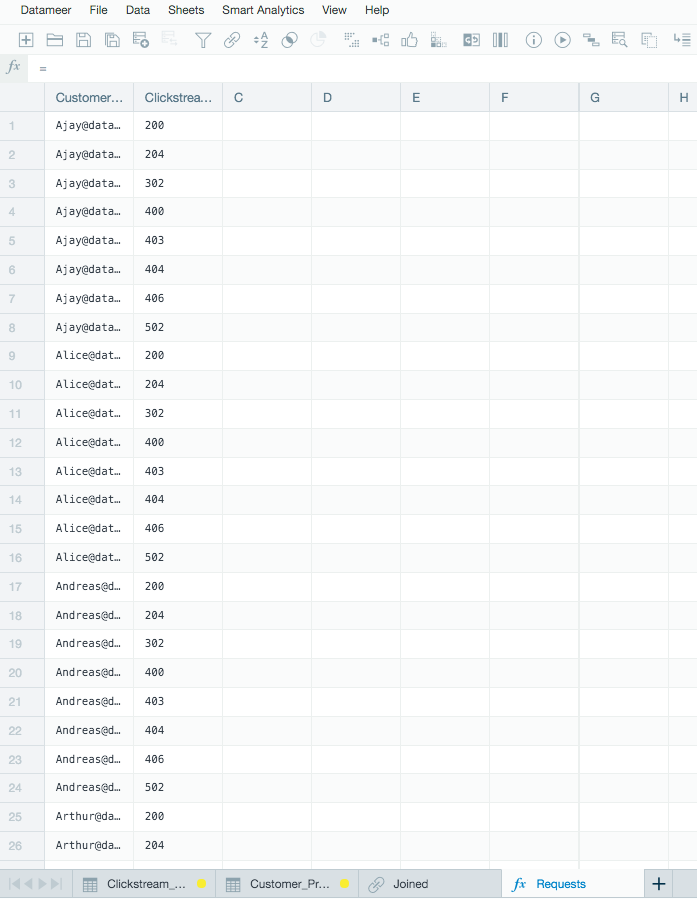
- Then group by Status code using the same procedure. This shows the email addresses grouped by status codes.
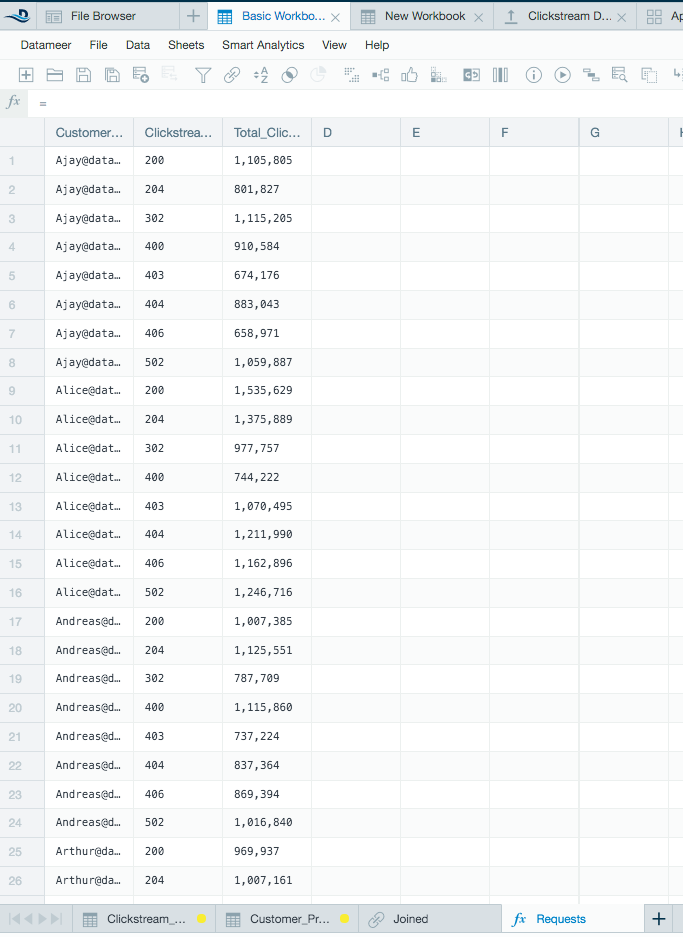
- Next you use GROUPSUM function. Click the third column of the Requests sheet and do a GROUPSUM of bytes sent from your joined sheet.
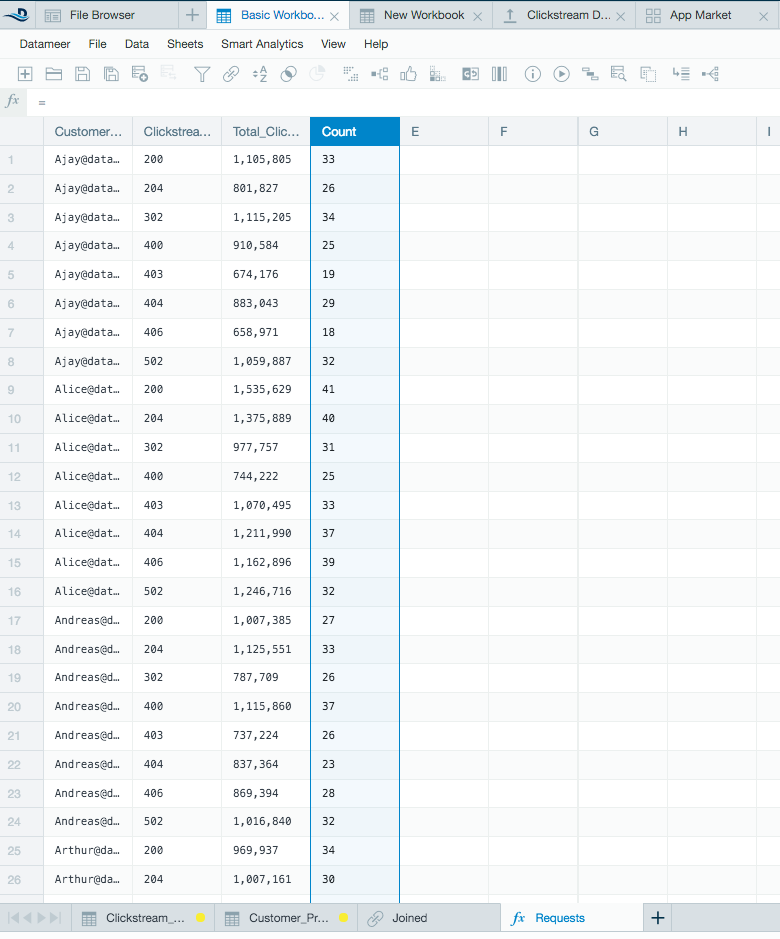
- Click the fourth column on the Requests sheet and use the GROUPCOUNT function.
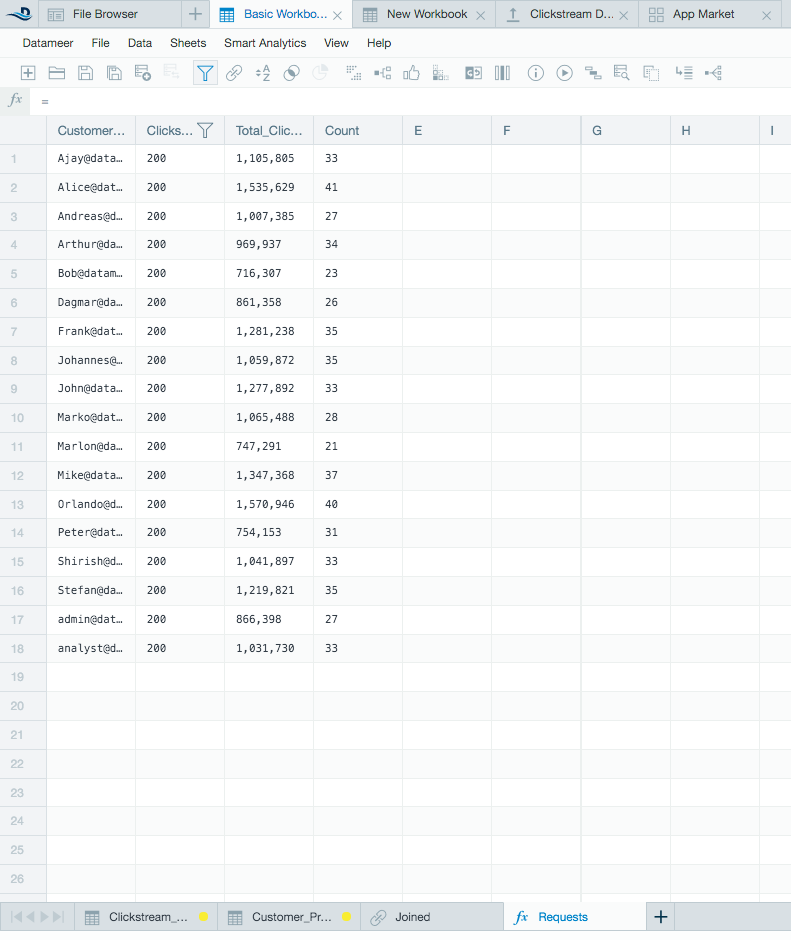
- From the Data menu, select Filter, and apply a filter of status code = 200 (successful web request to view page).
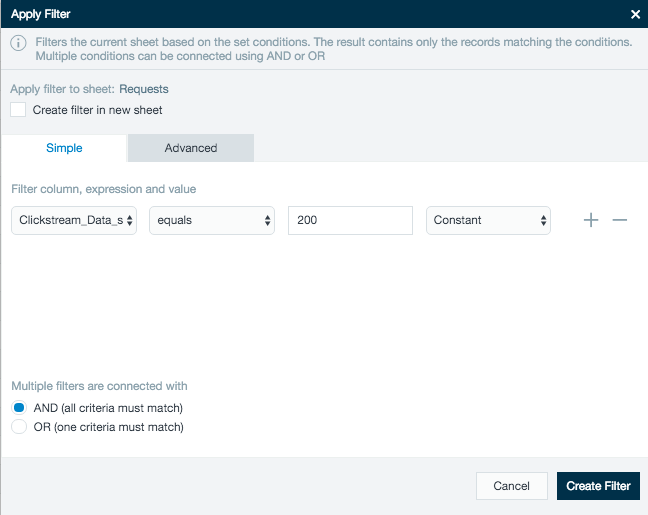
- Click Create Filter.
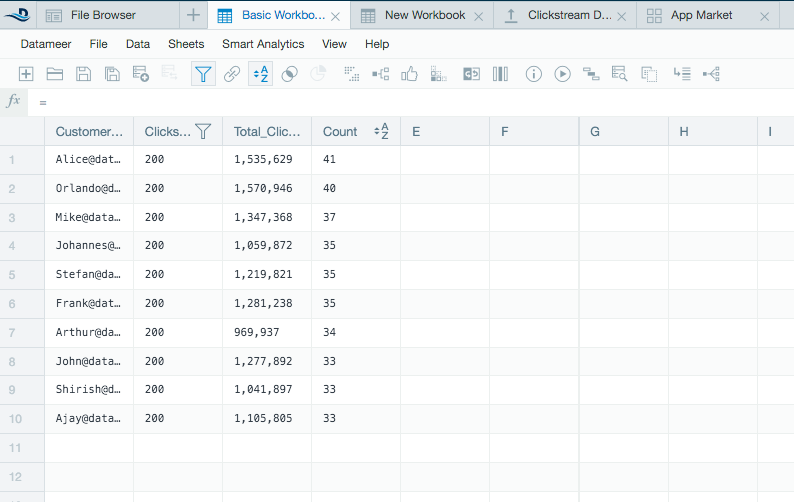
Sort the results
From the Data menu, select Sort.
- Select the Count column.
- To limit the results to the top users, select a value as a limit. In this example, the limit is 10.
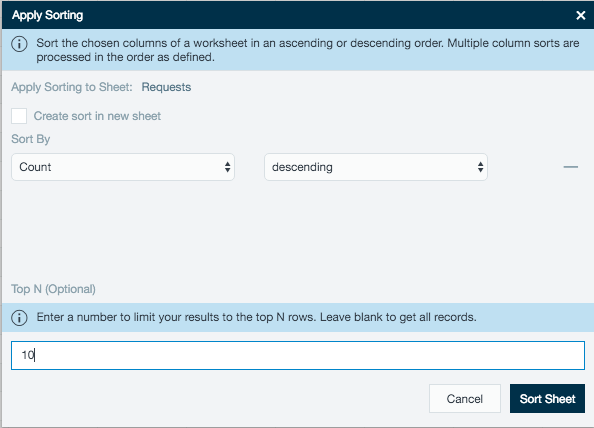
- Click Sort Sheet. The sheet is now sorted. Right-click to rename the sheet MostActiveUsers.