Grouping Functions
In Datameer X grouping functions are split into two distinct types of functions, group series functions and aggregate functions.
Group series functions in Datameer X are similar to aggregation functions - they group values that have the same key, but they don't aggregate values. The biggest difference between group series functions and aggregation functions is that group series functions usually have more than one result per key where as aggregation functions have only one result per key.
In order to use these functions you must first define groups within your workbook. This can be done using the GROUPBY (), GROUPBYBIN (), or GROUPBYGAP () functions.
Group Series Functions
Group series functions operate row-wise within a group. The function is applied to every row and therefore returns a value for every argument in the group.
INFO
Functions IF, AND, and OR (as well as operators && and ||) arguments are evaluated lazily. This evaluation strategy is used to prevent failures caused by evaluating expressions that may result in an exception.
Problems can occur around lazy evaluation when you are working with the functions that maintain state. This is true for all of the group series functions.
When using a group series function within an IF()'s 2nd or 3rd argument or the functions AND() / OR() in any argument position, Datameer X can't guarantee that all of their arguments will be evaluated.
The following functions in Datameer X are group series functions:
- GROUPACCUMULATE()
- GROUPBOTTOMN()
- GROUPBYBIN()
- GROUPBYCUSTOMBIN()
- GROUPBYGAP()
- GROUPCOMBIN ()
- GROUPPREDICTIVEWINDOWS ()
- GROUPROWNUMBER ()
- GROUPSESSIONS ()
- GROUPTOPN ()
- GROUPUNIQUES ()
- GROUP_DIFF ()
- GROUP_PAIR ()
- GROUP_PATH ()
- GROUP_PATH_CHANGES ()
- GROUP_PREVIOUS ()
- GROUP_SORT_ASC ()
Aggregate Functions
Aggregate functions combine and then operate on all the values in a group. The function returns one value for each group.
INFO
Due to the different nature of group series functions and aggregate functions, they can't be used in the same workbook sheet.
INFO
Aggregations functions applied to empty groups (all records have been filtered) will result in no entry, e.g. GROUPCOUNT() will not return 0 but no record.
The following functions in Datameer X are aggregate functions:
- GROUPAND ()
- GROUPANOVA()
- GROUPANY ()
- GROUPAVERAGE ()
- GROUPCONCAT ()
- GROUPCONCATDISTINCT ()
- GROUPCOUNT ()
- GROUPCOUNTSDISTINCT ()
- GROUPFIRST ()
- GROUPJSONOBJECTMERGE()
- GROUPLAST ()
- GROUPMAP ()
- GROUPMAX ()
- GROUPMEDIAN ()
- GROUPMIN ()
- GROUPOR()
- GROUPPERCENTILE ()
- GROUPSELECT()
- GROUPSTDEVP ()
- GROUPSTDEVS ()
- GROUPSUM ()
- GROUPTTEST()
- GROUP_HOLT_WINTERS()
- GROUP_JACCARD_DIST ()
- GROUP_MOVING_AVERAGE()
Real World Examples of Group Series Functions
Here we show a few examples of the power of using group series functions and how they can be used in your analyses:
Click stream analysis with session ID
Group series functions can be used for click stream analysis:
- Group according to the session key.
- Sort all values within each session by the timestamp.
- Generate click paths using the URLs.
For example, suppose you have the following input data:

Generating click stream information is done within one formula sheet:
=GROUPBY(#Input!SessionId)
=GROUP_SORT_ASC(#Input!Timestamp)
=GROUP_PATH_CHANGES(#Input!URL)
=GROUP_DIFF(#Timestamp)
=JSON_ELEMENT(#Path;0)
=JSON_ELEMENT(#Path;1)
The result of this sheet looks like this:

After that, you can do whatever analysis is required, for example, you could do the following:
- Find the page where users spend most time on by:
- Doing GROUPBY(#ClickStream!From) and GROUPMEDIAN(#ClickStream!TimeSpent).
- Sorting by TimeSpent.
- Find the page where a user most often leaves the application by:
- Filtering all records, where #ClickStream!To == "external".
- Doing GROUPBY(#From) and GROUPCOUNT().
- Sorting by count in descending order.
- Find most often page transitions by:
- Doing GROUPBY(#ClickStream!From), GROUPBY(#ClickStream!To) and GROUPCOUNT().
- Sorting by count in descending order.
Click stream analysis without session ID
In many cases you might not have a session ID in your data so you can't group on a session as easily. But usually it's possible to extract a session from your data. For example, if you have IP addresses and timestamps in your server log, you could assume that for each IP address a new session begins when there is a gap of more than x minutes between one and the next log entry. This means that the request is coming from the same machine, but it's probably a different session. The GROUPBYGAP function helps you determine the session information.
For example, suppose you have the following input data:

Generating click streams can be done within one formula sheet:
=GROUPBY(#Input!IP)
=GROUPBYGAP(#Input!Timestamp;10m)
=#Input!Timestamp
=GROUP_PATH_CHANGES(#Input!URL)
=GROUP_DIFF(#Timestamp)
=JSON_ELEMENT(#Path;0)
=JSON_ELEMENT(#Path;1)
The result of this sheet looks like this:

Market basket analysis
Another use case for group series analysis is determining which products have been bought together in one transaction in order to do recommendations. To do this analysis, you can use a GROUP_PAIR function that creates all pairs of a value within one group.
Suppose you have a data structure such as this: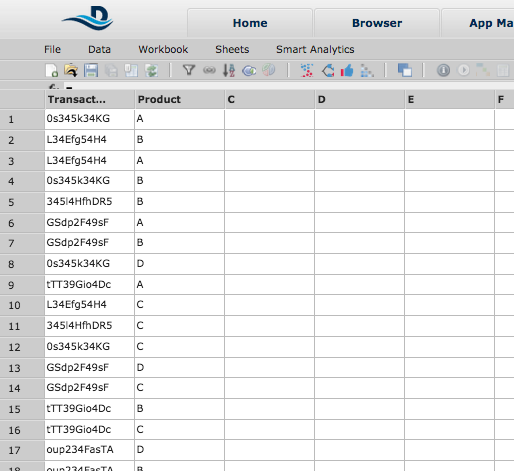
You can now do the following analysis:
=GROUPBY(#Input!Transaction)
	-The GROUPBY function groups all the transactions of the same value together.
=GROUP_PAIR(#Input!Product)
	-The GROUP_PAIR function can be used after a GROUPBY function to return all pairs of values of each GROUPBY value in a list.
=LISTELEMENT(#Product_Pairs;0)
=LISTELEMENT(#Product_Pairs;1)
	-The LISTELEMENT functions are used to extract the first and second elements of the list into separate columns.
The result sheet looks like this: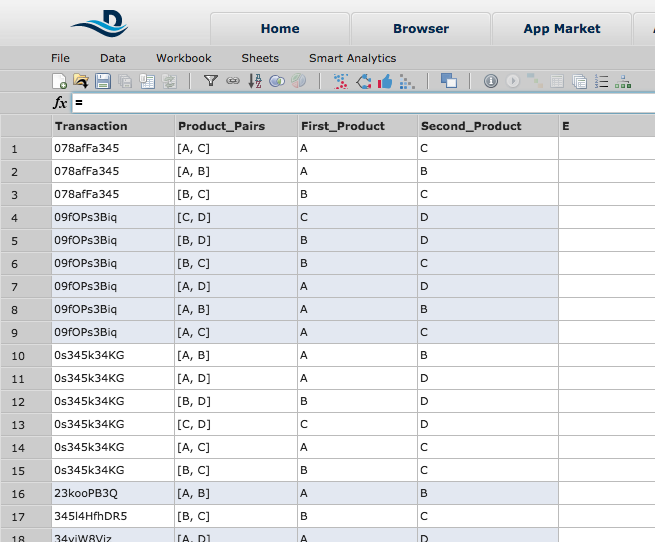
Next, you can aggregate on pairs to see which pairs occur most often in one transaction.