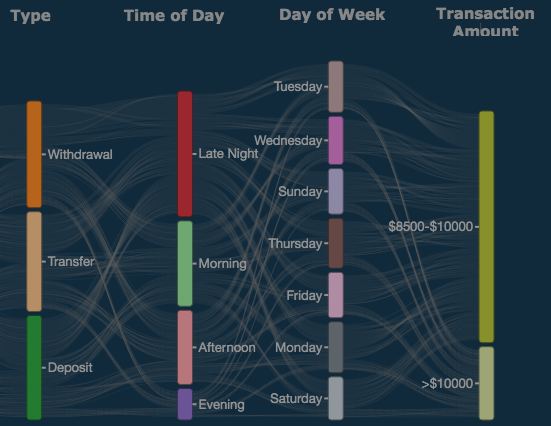
Sankey Diagram
The Sankey diagram displays a flow of how variables behave on a path from one set of values to another. Node is the given name of the different variables and a link is the name to a connection between nodes.
Configuring the Sankey Diagram
Here you can find out what kind of data can be represented as a Sankey diagram and what options you have to represent your data. General steps for configuring widgets are explained on the Visualizing Data page.
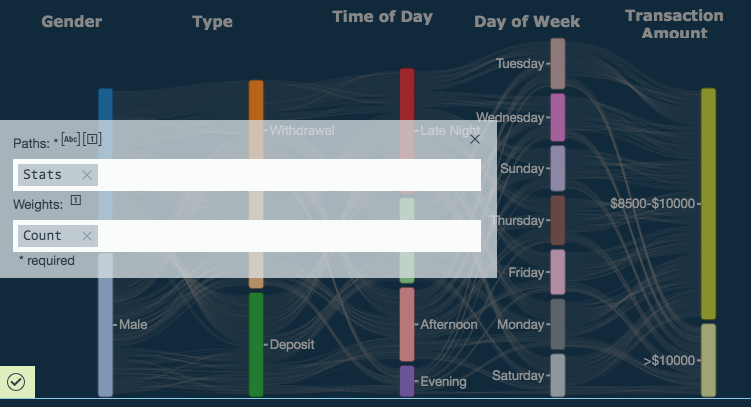
Data Requirements
The Paths level of the Sankey widget must be filled in with a single list data type. The Weights level of the Sankey widget must be filled in with a single number value.
Appearance - Specific Settings
The appearance of a Sankey diagram can be adjusted through standard and specific settings.
Standard widget settings give you basic controls in order to customize a widget. Learn more about standard widget settings here.
Specific widget settings give you more controls over details pertaining to the Sankey widget. With these controls, you are able to adjust your widgets to create the perfect infographic to fit your needs.
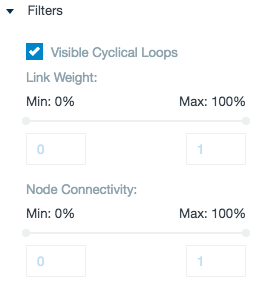
Filters
The filters for Sankey diagrams give you cyclical loop, link weight and node connectivity options.
Cyclical loops are links that move backwards in the diagram (displayed in red). This options allows to filter out these paths in the diagram.
The link weight and node connectivity options make it possible to show more important (larger) nodes and paths being used.