GROUP_MOVING_AVERAGE
Syntax
GROUP_MOVING_AVERAGE(<number>;[<number>])
Values: time series values
K: number of past values to compute the moving average from
Description
This function smooths a time series by applying a simple moving average of the past k values. Smoothing a time series helps remove random noise and leave the user with a general trend. You might use GROUP_HOLT_WINTERS for exponential smoothing.
This is an aggregate function.
Example
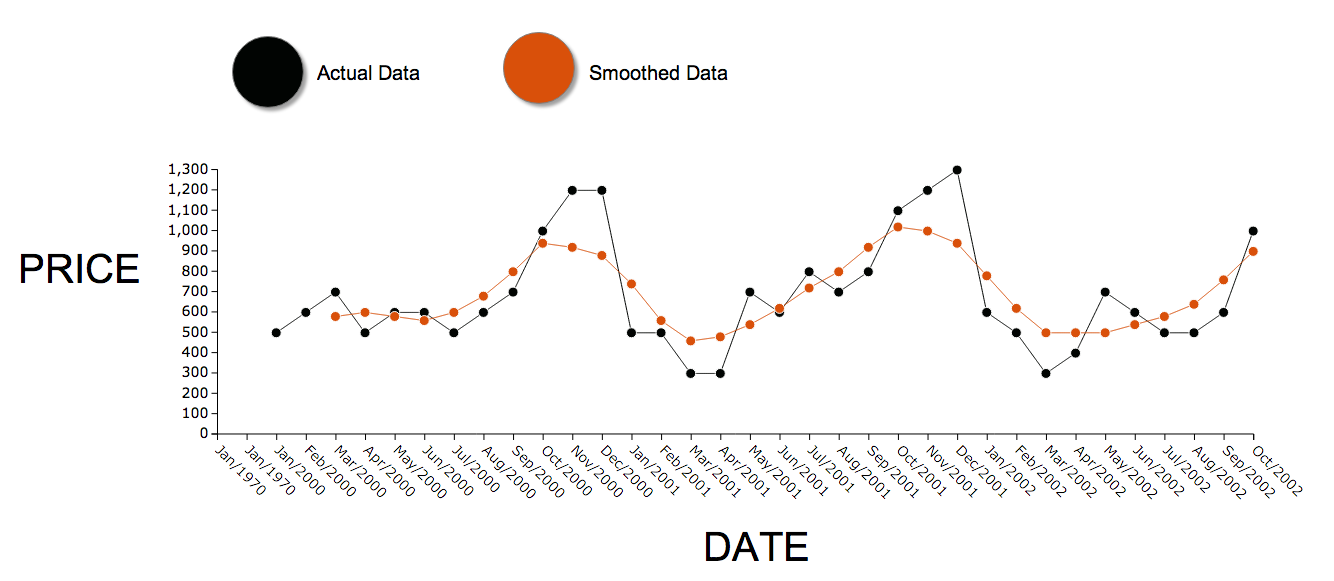
In the following example you have average stock price values per month over a three year period. Try to smooth the data to find the general trend.
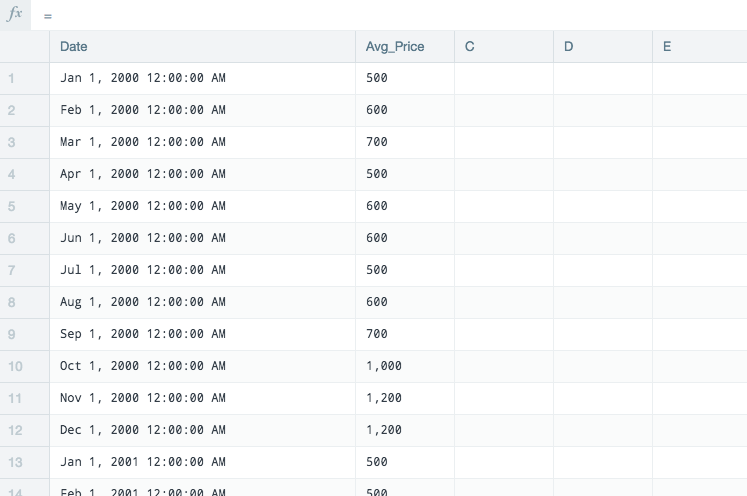
Next, duplicate this source into a calculation sheet in order to work on it.
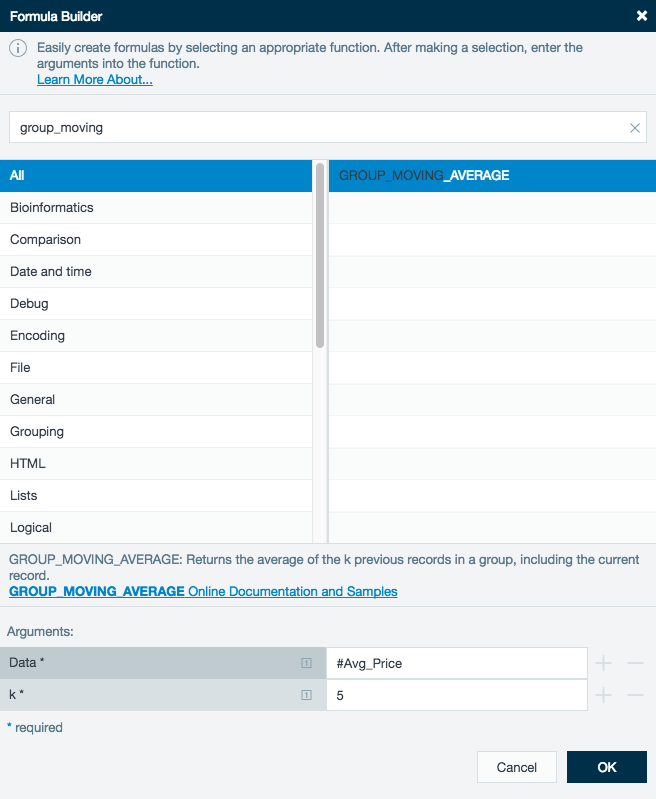
Click an empty column to bring up the Formula Builder (As of Datameer X v6.4, click the Fx button on the formula line to display the formula builder) and select GROUP_MOVING_AVERAGE
Use the Avg_Price as the Data and set the k at 5. This uses each previous 5 months to create a smoothed average for each data record.
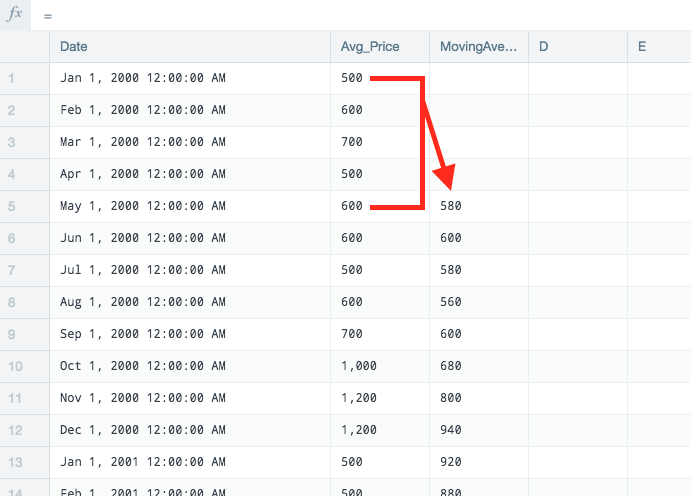
The first record in the column MovingAverage_Price_5 is an average of the first 5 records of Avg_Price.
As the Moving_Average_Price_5 records are the average of the previous 5 Avg_Price records, the Moving_Average needs to match to the median of the Date and Ave_Price.
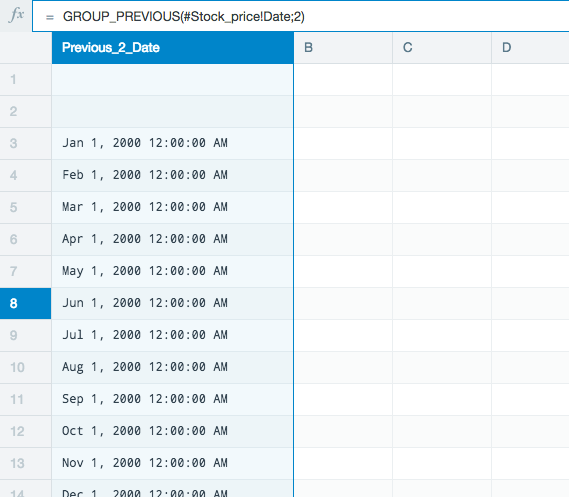
Create a new sheet and click the first open column to bring up the Formula Builder. Select GROUP_PREVIOUS to shift the Date column down two rows.
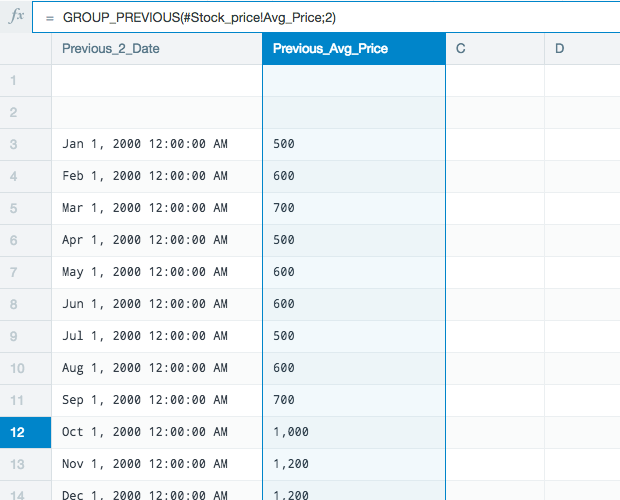
Use the same GROUP_PREVIOUS function to shift the Avg_Price down by two rows.
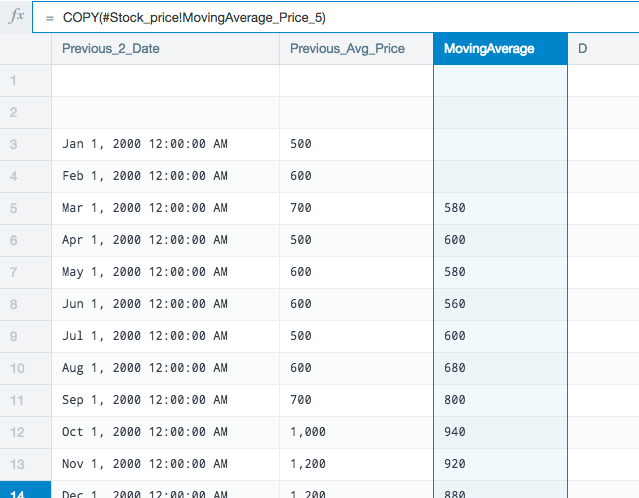
Finally, COPY the MovingAverage_Price_5 into the sheet.
The moving average values are now properly aligned with the median date and price the moving average is based on.
After having completed the workbook, a line chart would be a good tool to visualize your new smoothed data compared to your actual data.